
MRR data editing
MRR data editing enables you to connect customer subscriptions and manually edit MRR to ensure ChartMogul accurately reports customers’ subscription history. Editing a customer’s data in ChartMogul doesn’t impact data in your billing system.
Learn about other ways you can correct data in ChartMogul:
- Cleaning data imported from a billing system
- Merging customers
- Excluding customers from being reimported
- Adding subscriptions manually
Here’s what we cover in this article:
- Before you begin
- Reasons for manual data editing
- Using manual data editing tools
- Connecting subscriptions
- Editing MRR
Before you begin
- Make sure you know how to access a customer’s Monthly Recurring Revenue chart.
- Learn more about MRR movements.
Reasons for manual data editing
Here are some cases when you may need to manually edit your MRR data:
- Switching billing systems — When you switch billing systems, ChartMogul reports two separate subscriptions for a customer. MRR data editing allows you to connect these subscriptions for accurate reporting.
- Messy billing data coming through from your billing system — ChartMogul may generate inaccurate MRR movements when billing data isn’t imported correctly. For example, someone on your team set up a subscription in your billing system manually and didn’t configure it correctly. Manual MRR editing allows you to update these MRR movements. Learn more about MRR movements.
- Customers reactivating soon after they’ve churned — MRR data editing allows you to remove short interruptions to customers’ subscriptions. These may happen, for instance, when a customer’s card has expired, and they only notice it once they lose access to your service.
Using manual data editing tools
You’ll need to have a Staff, Admin or Owner Staff, Admin or Owner role to access data editing tools.
Navigate to a customer’s record and locate their Monthly Recurring Revenue chart under the Revenue tab to view the options to EDIT MRR and CONNECT SUBSCRIPTIONS.

Press Shift, then click and drag your mouse to zoom into a portion of the graph.
Double-click the graph or click RESET ZOOM to reset to the default zoom level.

By default, overlapping subscriptions are stacked, showing the total MRR for the customer at any given time.

Click UNSTACK to see the individual MRR contribution of each subscription.

Connecting subscriptions
Connecting subscriptions does not sum the MRR from two subscriptions. It combines subscriptions consecutively to create a seamless subscription history. You can only connect subscriptions that are invoiced in the same currency.
When subscriptions are connected, only the primary subscription’s custom attribute values are kept. Any values previously set on the other connected subscriptions are overwritten.
ChartMogul allows you to connect a customer’s subscriptions to accurately reflect your history with this customer. Subscriptions can only be connected when at least one of them has been canceled.
To connect subscriptions:
- Click CONNECT SUBSCRIPTIONS.
-
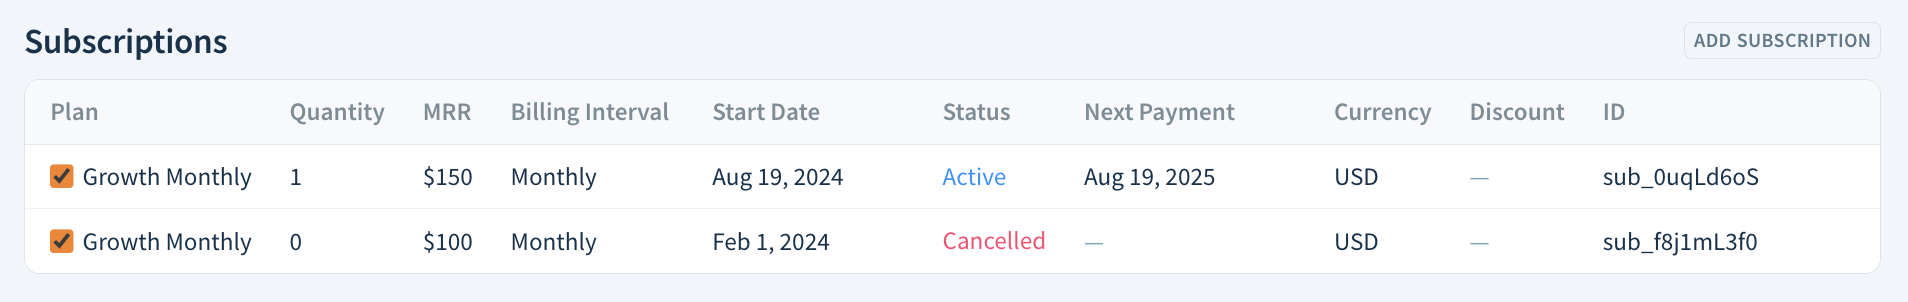
Select two or more subscriptions by clicking the graph or selecting checkboxes in the Subscriptions table.
-
Click CONNECT. The most recent active subscription will become the primary subscription.
-
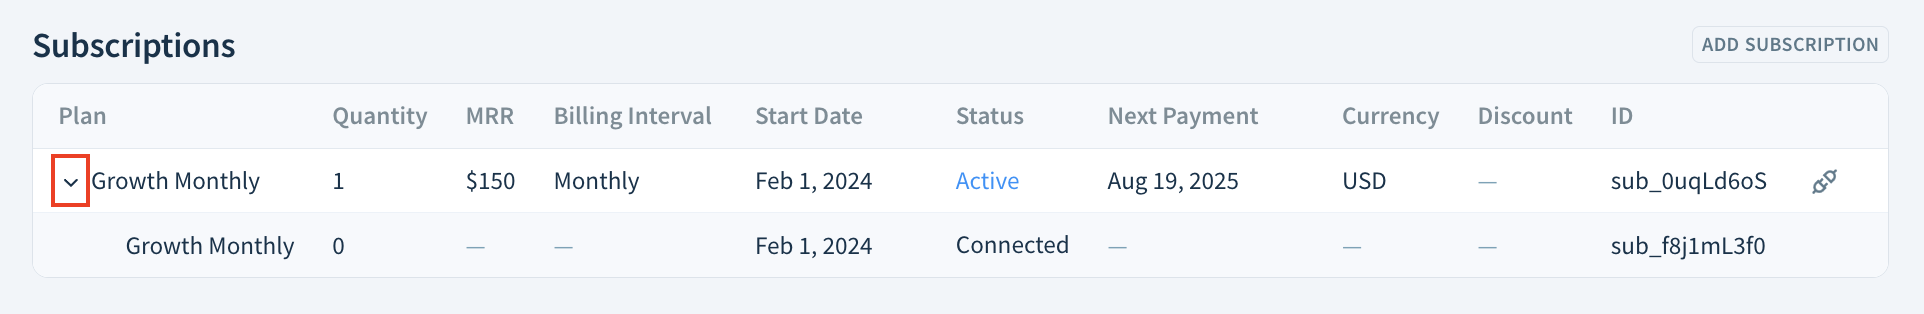
After connecting subscriptions, expand the primary subscription in the Subscriptions list to reveal the ones connected to it.
-
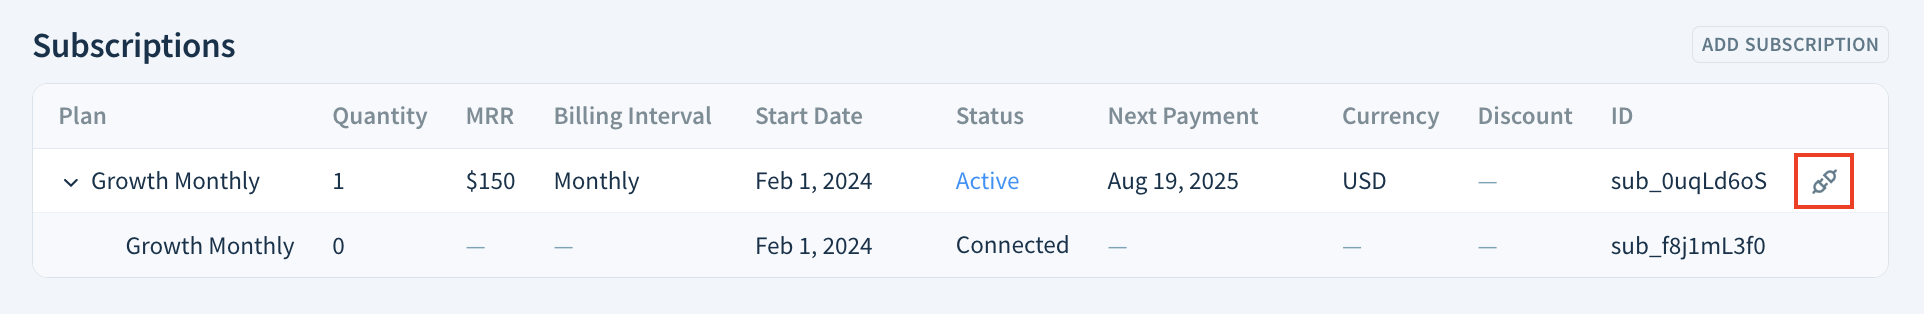
To revert your changes, click the unplugging icon.


Subscriptions with a gap period
There may be a gap between the end date of the old subscription and the start date of the new subscription. When connecting such subscriptions, ChartMogul fills the gap with the MRR amount from the old subscription.
There is no upper limit to the gap length between subscriptions.
The following graph shows two subscriptions with a gap period between them:

After connecting these subscriptions, the gap period is filled with the MRR amount from the old subscription:

Subscriptions with an overlapping period
When connected subscriptions have an overlap in service periods, ChartMogul doesn’t sum their total MRR during the overlapping period. Instead, ChartMogul uses the MRR amount from the new subscription and overrides and ignores the MRR from the old subscription.
The following graph shows two subscriptions with overlapping service periods:

After connecting these subscriptions, the overlapping period is filled with the MRR amount from the new subscription, and the MRR amount from the old subscription in this period is ignored:

Editing MRR
ChartMogul allows you to edit MRR data to clean up incorrect MRR history. Editing MRR only changes historical MRR data.
Data edits cannot be removed. However, there is no limit to the number of times data can be edited.
Re-syncing a customer does not remove any MRR edits. Deleting and re-adding a source removes all MRR edits.
To edit the amount of MRR:
- Click Edit MRR.
- Select the red handle on a movement and move it up or down to the appropriate MRR value. You can also input an exact MRR value into the box on the bottom right.
- Click Save Changes to apply the modification.
- The graph will automatically reload to show the changes.

Edited MRR is displayed as a yellow point. Hovering over this point displays the MRR edit, the date it was made and the team member who made the change.
