
Getting started with CRM reports
CRM Reports is a ChartMogul feature that combines lead, trial, opportunity, and subscription data so you can analyze your entire sales funnel — from first touch to closed deal — in one place.
This guide covers the reports most useful for sales and marketing teams: lead flow, trial-to-paid conversion, pipeline coverage, and new MRR forecasting. For a real-time snapshot of sales goals and activity, see the default Sales dashboard.
How to track lead flow with the Leads report
Leads reports the number of people who enter your sales pipeline — that is, anyone who has shown interest in your product and been added to CRM. Sales and marketing teams use this report to track lead flow over time.

Use this report to get insights on:
- The number of leads who have started the sales process to evaluate your product/service, using the Has opportunity filter
- How many leads are qualified (vs. unqualified) using a custom attribute, such as SQL
- Which marketing channels are generating the highest quality leads and use this to allocate budget, using custom attributes
Apply the same insights to Free Trials.
How to measure trial-to-paid conversion rates
Trial-to-Paid Conversions reports the percentage of customers who start a trial and subsequently subscribe. Sales and marketing teams use this report to understand how effectively trial users are converting into subscribers and if they share any common characteristics.

Use this report to get insights on:
- How sales rep vs. self-serve deals convert using custom attributes
- When a customer subscribes during the onboarding journey using the Trial-to-paid in days filter. Learn more about making trial-to-paid conversion rates more meaningful with cohorts.
How to analyze your pipeline with Pipeline Funnel Analysis
Get an overview of your sales funnel and how effectively your business is converting leads with Pipeline Funnel Analysis.
Sales leaders use this report to understand how many leads and opportunities are needed to hit sales targets and plan pipeline coverage — that is, ensuring you have enough deals in progress to meet your revenue goals.

Use this report to get insights on:
- How your business’ sales-led efforts compare to your self-service model
- The effectiveness of your go-to-market strategy. For example, if your self-serve segment has a larger average won opportunity and lower acquisition cost, consider increasing top-of-funnel leads there.
How to Forecast New MRR with Deal Stage Probability Forecast
Get an estimate of the amount of new MRR in a month with Deal Stage Probability Forecast. Sales and finance leaders use this report to forecast sales revenue.
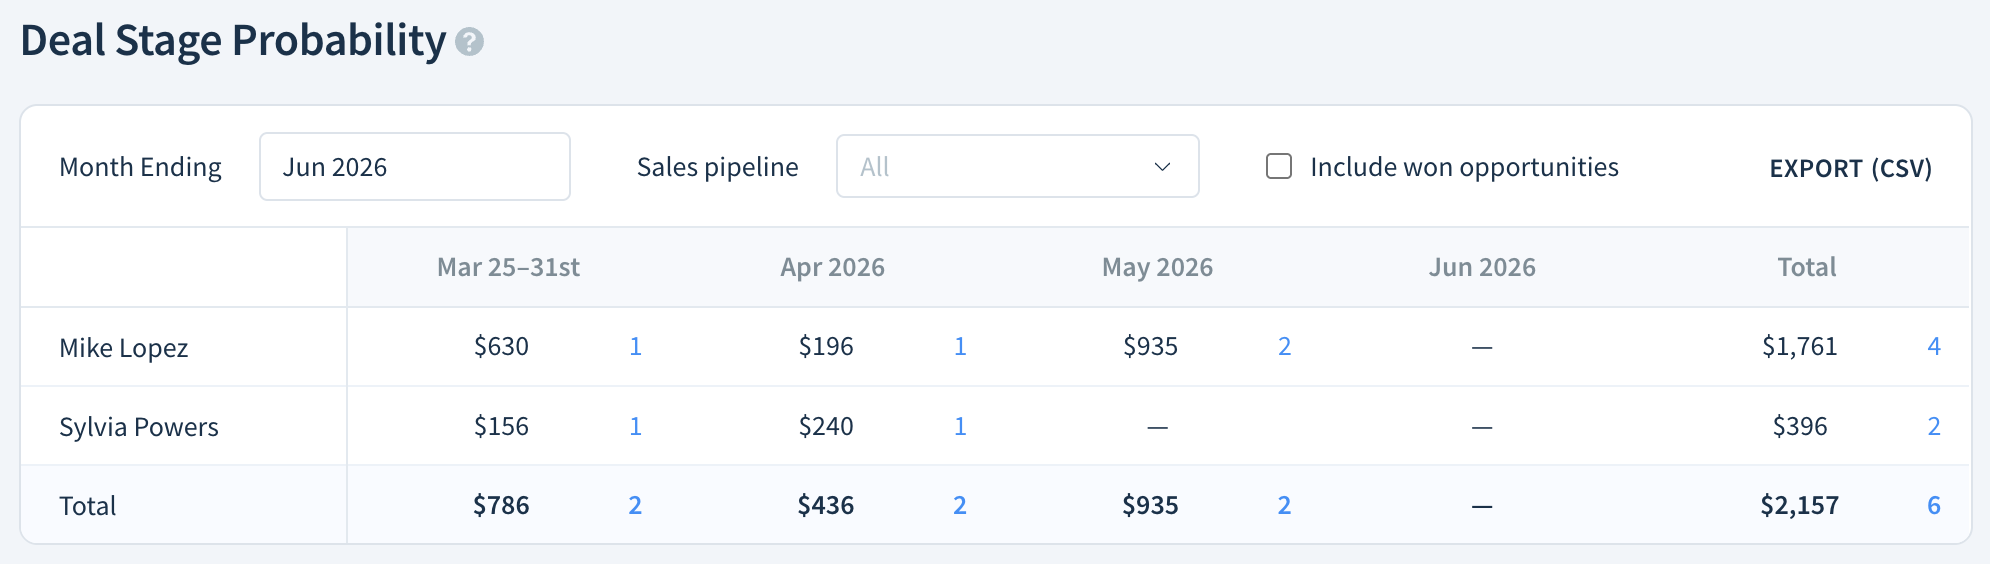
Use this report to get insights on:
- Forecast accuracy: compare the forecasted revenue amount to actual revenue
- The expected revenue for each sales rep
- The estimated revenue in a particular pipeline
Deal Stage Probability Forecast is a weighted forecast — it multiplies deal value by win likelihood percentage to give you a standardized revenue estimate. It's most useful for teams with a high volume of opportunities, long sales cycles, or a wide range of deal sizes. Keep in mind that not every deal closes, so the forecast is an estimate, not a guarantee.
How to review forecast confidence with Forecast Category Report
Forecast Category Report is an overview of new MRR — Monthly Recurring Revenue — in each forecast category (a label a sales rep assigns to a deal to signal how likely it is to close) by sales rep. When a sales rep updates the deal's forecast category, it indicates greater confidence that a deal will be won. This report is useful for sales leaders and sales reps.

Sales leaders use this report to see each forecast category broken down by sales rep, across all pipelines or a specific one. Use it to track progress toward sales targets and allocate resources.
Sales reps use this report to review opportunities and focus on deals most likely to close.
How to Use Dashboard Reports for Pipeline and Rep Performance
ChartMogul offers dedicated dashboard reports that give sales teams an at-a-glance view of pipeline health and rep performance. Add them to a personal or shared dashboard to:
- Rank reps by the value of won and committed opportunities
- See new business MRR broken down by forecast category
- Track pipeline created over time
Opportunity lists
ChartMogul offers default lists for managing opportunities. The header of each list provides helpful insights for sales teams.

Sales leaders can review All won opportunities to see how much MRR each sales rep brought in during a defined period, useful when calculating commission.
Review All lost opportunities to see which marketing channel has the most losses and view a report of loss reasons, using custom attributes.
Sales reps use opportunity lists to manage their workflow. Learn more in our CRM user guide.
Next steps
- Get started with reports — configure, save, and share them
- Use segmentation to dig deeper into your data, including custom attributes and filters
- Customize your dashboards, including the CRM reports dashboard
- Set targets to track your business goals in ChartMogul
- Create tasks to stay on top of leads, opportunities, and customers