
Segmenting churn by early product adoption
This tutorial shows you how to analyze Monthly Active Users (MAU) and its impact on churn by comparing accounts with more than three active users in the first 90 days to those with three or fewer.
Analyzing churn by MAU count helps you spot which accounts are at risk early — and which are likely to stick around.
For this tutorial, an account counts as "adopted" if at least three unique users perform any activity — such as logging in — in each of the first three months after activation (the date the subscription becomes active).
Tracking early product adoption
To begin, you'll want to track how many users on an account were active during their first month. If you’re not already importing this data into ChartMogul, check out our article on custom attributes.
You can calculate this attribute using data from your internal product usage database or analytics tools like Segment, Mixpanel or Amplitude.
Your customer usage data can be synced with ChartMogul via CSV upload or automatically using our API.
Once added, this custom attribute, called something like MAU_First_M, will appear on the customer record.
You can view and filter this attribute just like any other in ChartMogul.

Filtering your churn rate by monthly active users
To compare churn performance by product adoption level, navigate to the Customer Churn Rate report and follow these steps:
- Click the Apply a filter or saved segment button.
- Search for the attribute MAU_First_M.
- Create the filter is less than or equal to 3.
-
Click Add.
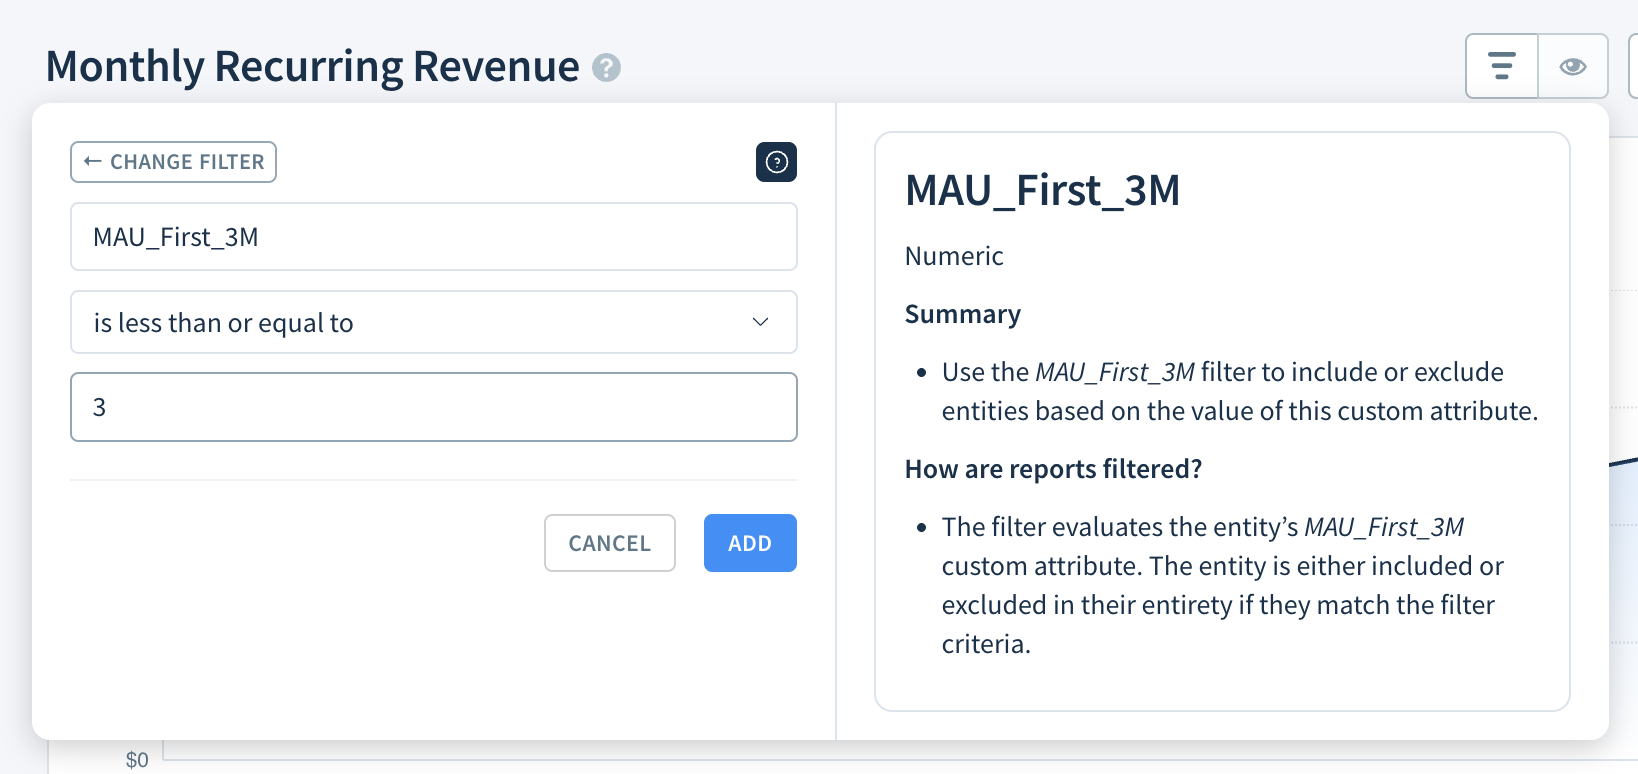
- Repeat steps 1–4 to add another segment where MAU_First_M is more than or equal to 4.
You now have two segments to compare: accounts with strong early adoption (4+ MAUs) and those with weaker adoption (3 or fewer MAUs).
Comparing churn by monthly user activity

The report above shows churn rate for two cohorts over a 5-month period:
- Accounts with 4 or more monthly active users in their first month (shown in turquoise).
- Accounts with 3 or fewer monthly active users in their first month (shown in dark blue).
How to interpret the churn comparison
Accounts with greater early product adoption churn significantly less over time. Notably, churn in low-usage accounts spikes in January, while high-usage accounts maintain a lower rate throughout.
This pattern confirms what many SaaS teams have experienced anecdotally: accounts with broad early adoption are more likely to stick around.
How to act on this data
- Improve onboarding: prompt new customers to invite teammates within the first two weeks.
- Set CS triggers: flag accounts with 3 or fewer active users at day 30 for outreach.
- Use product marketing: show admins how other departments use the product to drive broader adoption.
What This Analysis Tells You About Retention
Segmenting churn by monthly user activity gives you a valuable leading indicator of customer retention. By tracking and filtering based on this attribute, you can identify accounts at risk earlier, guide users more effectively and create CS and product experiences that retain more customers.
Use these segments to tie early adoption to revenue outcomes and make your retention strategy more proactive.