
Setting goals with targets
Targets in ChartMogul let you set monthly, quarterly, or annual goals for key metrics—such as MRR, ARR, paid subscribers, or won opportunities—and track progress against them directly on a dashboard.
Use targets to monitor goals like reaching $5M ARR by year end or the MRR milestone needed to become a $1M business, visible to all users with access to that dashboard.To set targets in line with your industry and peers, use Benchmarks.
You’ll need to be an Admin or Owner in ChartMogul to manage targets. Read more about roles and permissions.
Creating a metric target
To create a target to track metrics:
- Navigate to a dashboard.
- Click the Settings (gear) icon.
- Select Add a report to this dashboard > Default Charts > Target.
- Choose the metric to track: MRR, ARR, Paid Subscribers, or Net Cash Flow.
- Select the target interval: Monthly, Quarterly, or Yearly.
- Finally, enter the total amount for your target.
Click SAVE.
Creating a won opportunities target
To create a sales target for the current quarter:
- Navigate to a dashboard.
- Click the Settings (gear) icon.
- Select Add a report to this dashboard > Default Charts > Won Opportunities Target.
- Set a target for All pipelines or choose a specific pipeline using the drop-down.
- Enter the value for opportunities you’d like to win.
Click SAVE.
ChartMogul adds your target and makes it visible to all users with access to the dashboard.
Targets calculation
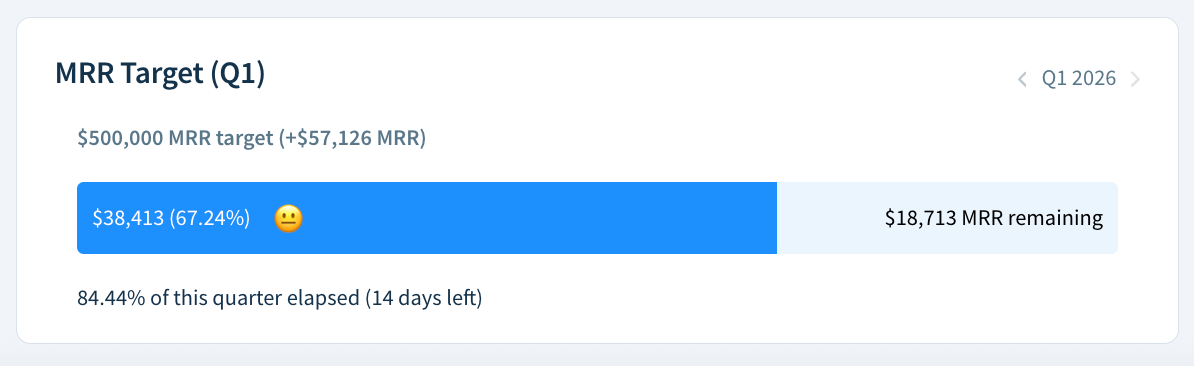
ChartMogul calculates target progress based on the amount remaining to reach the target, not the total for the metric at the time the target is set. For example, Tetoko wants to reach $500,000 ARR by the end of the year. When they set the target, their ARR is $125,000. ChartMogul sets the target amount to $375,000 (the remaining gap). Their progress starts at 0%, not 25%, even though they’ve already achieved $125,000 ARR.
Editing, moving, or deleting targets
To manage a target, hover over the target title for the Settings (gear) icon to appear, then select an option:
- Edit – Adjust the target’s metric, interval, or amount. ChartMogul updates your target and adjusts its progress to reflect your changes.
- Move to – Remove the target from the current dashboard and move it to another one.
- Duplicate to – Create a copy of the target to appear on another dashboard.
- Remove – Delete the target from the current dashboard. This action is permanent.
Next Steps
- Customize your dashboards to have easy access to your most important charts and metrics.
- Set up email or Slack notifications to receive updates for MRR movements.
- Create and share custom reports.