
Maps
Maps is a ChartMogul feature that displays your key subscription metrics — like MRR and churn — as geographic heat maps across 284 regions, including US states. See the complete list of supported regions.
To access Maps, choose Data Lab > Maps from the main navigation.

Use Maps to view the following metrics by region:
- MRR (Monthly Recurring Revenue — the total normalized monthly revenue from active subscriptions)
- Customers
- Average Revenue Per Account (ARPA — MRR divided by the number of active subscribers)
- Average Sale Price (ASP — the lifetime average value of a sale)
- Customer Churn Rate (the percentage of customers who cancel in a given period)
- Customer Lifetime Value (LTV — the predicted total revenue from a customer over their lifetime)
Here’s what we cover in this article:
How to Segment Maps
Segment maps by region, plan, or custom attribute (extra data fields you add to customer records). If you use the same filters often, save them as a segment — a reusable filter set — for easier access. Learn more about segmentation.
Your account comes with several regions by default, including Americas, APAC and EMEA. To create a custom region, click each region you’d like to include. Then, click Save Region, enter a name for your region and click Save.

To segment your map by US States, find the United States on the map and click Show States.

How ChartMogul Calculates Map Metrics
ChartMogul calculates maps as follows:
Monthly Recurring Revenue Heat Map – The sum of MRR for all Active and Past due subscriptions in the region.
Customers Heat Map – The sum of customers with at least one Active and Past due subscription in the region.
Average Revenue Per Account Heat Map – Current MRR in the region divided by the number of current subscribers in the region.
Average Sale Price Heat Map – The lifetime average sale price in the region.
Customer Churn Rate Heat Map – The average customer churn rate from the past six calendar months in the region.
Customer Lifetime Value Heat Map – The average revenue per account (ARPA) in the region divided by a six-month trailing average of customer churn rate in the region (the average of the churn rates from the previous six months, excluding the current month).
Why is some data missing from Maps?
Maps relies on customer location data imported from your billing system. If a customer signs up without providing a credit card or billing address, ChartMogul won’t have location data for that customer.
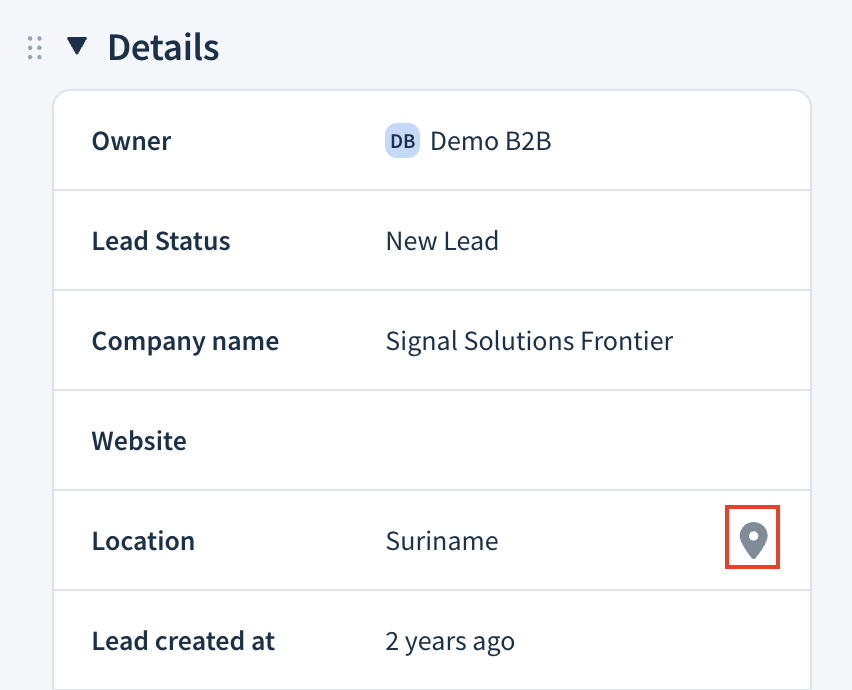
You can check a customer’s location in their record under Details > Location. If no location is listed, that customer won’t appear on your map.
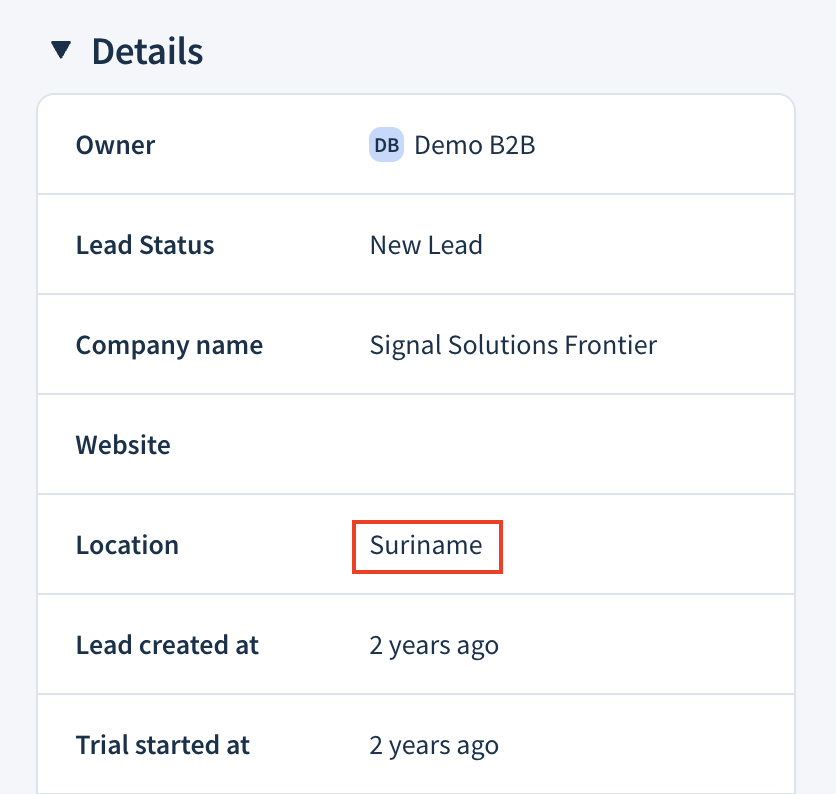
You can update a customer’s location in several ways: edit it directly in the customer record by clicking the pencil icon next to the field, update multiple records at once using a flexible CSV import, or automate updates programmatically through the API.
How to Gain Insights with Maps
Here's how maps can help grow your business:
- Find regions with the highest churn. Focus retention efforts there to lower your overall churn rate.
- Spot regions with high ARPA. Increase marketing spend there to attract more high-value customers.
- Look for regions where MRR is low but the market is large (like the United Kingdom). Consider how you can grow there.
- If your business is concentrated in one or two US states, use the map to identify where you can expand.