
Chart: Failed Transactions
The Failed Transactions chart tracks how many customers have had one or more unsuccessful transaction attempts over time. Failed transactions are a leading cause of passive churn (lost subscribers who never intended to cancel) and represent directly recoverable revenue.
Monitoring this chart helps teams stay ahead of payment failures before they become cancellations, making it an essential tool for churn prevention and accounts receivable workflows.
If you're new to ChartMogul, get to know how charts work.
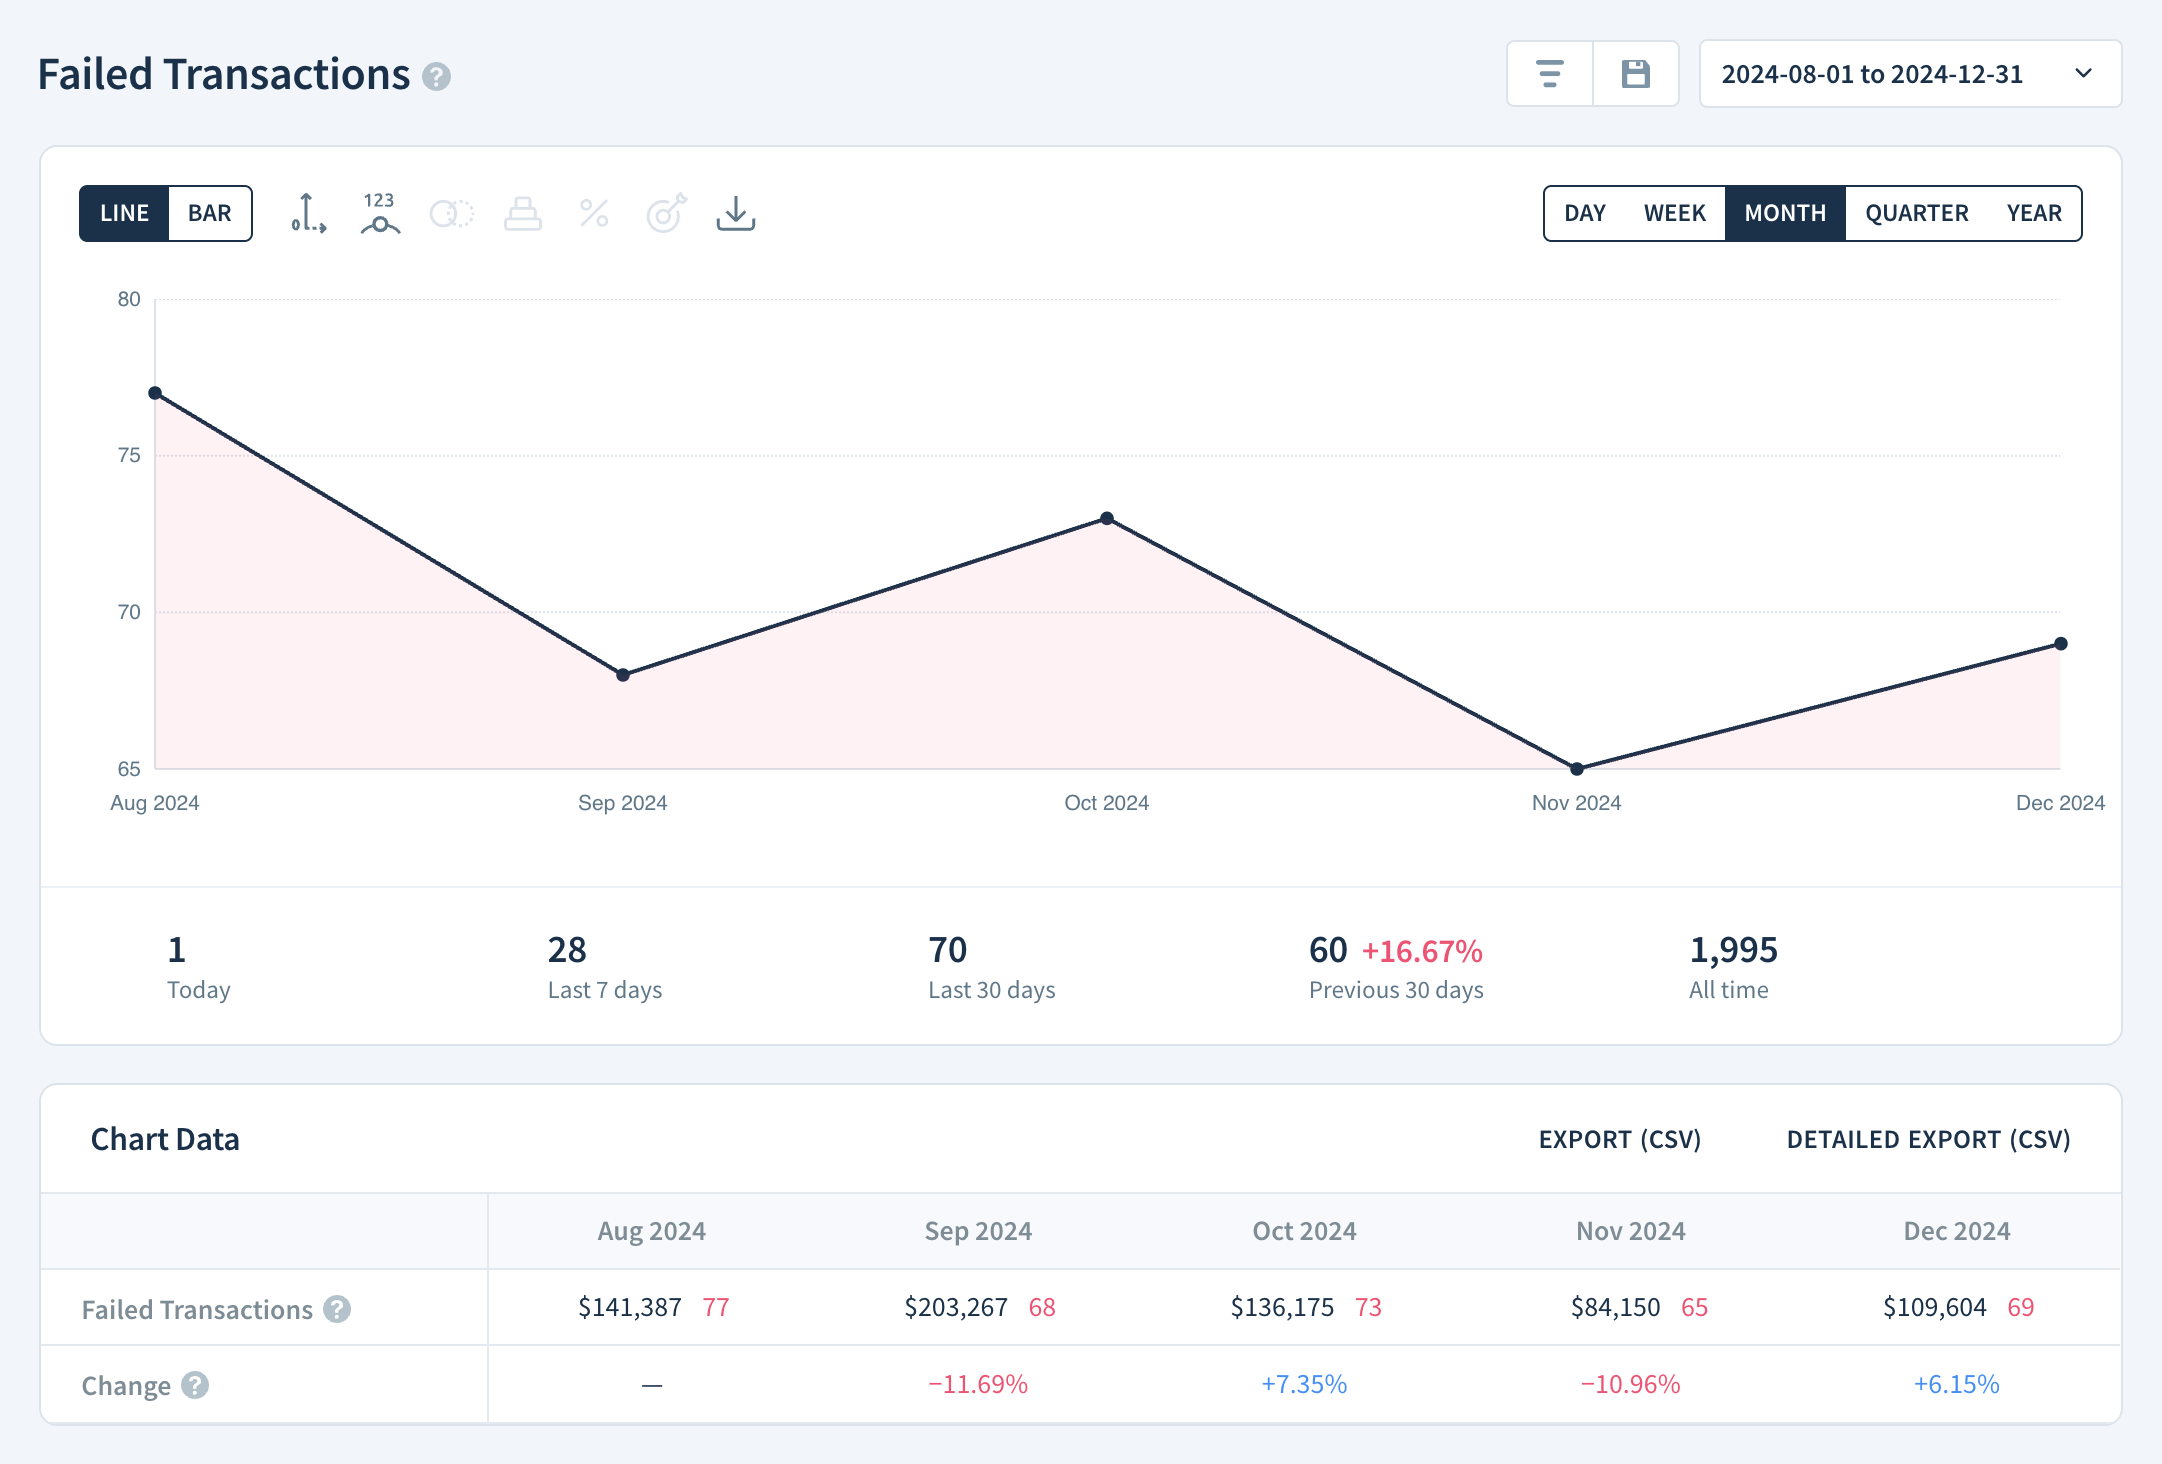
Chart Notes
A customer with multiple failed transactions in a given report interval contributes to this metric only once in that interval.
Calculation
ChartMogul calculates Failed Transactions as the total number of customers with one or more failed attempts to collect and settle a payment or refund for an invoice in each report interval.
Chart Data
The Chart Data table for Failed Transactions works differently than other charts. It provides the following breakdown:
- Failed Transactions — The total of the failed transactions in the report interval.
- Change — The increase or decrease in Failed Transactions from the previous report interval, shown as a percentage.
Select a Failed Transactions cell to see a list of customers with failed transactions in the report interval.
Download all paid invoices for the reporting period by clicking Detailed Export (CSV) above Chart Data. Learn more.
Next Steps
- View Successful Payments for a list of customers whose payments have been successful.
- Use segmentation to view failed transactions for specific groups of customers.