
Chart: Average Customer Lifespan
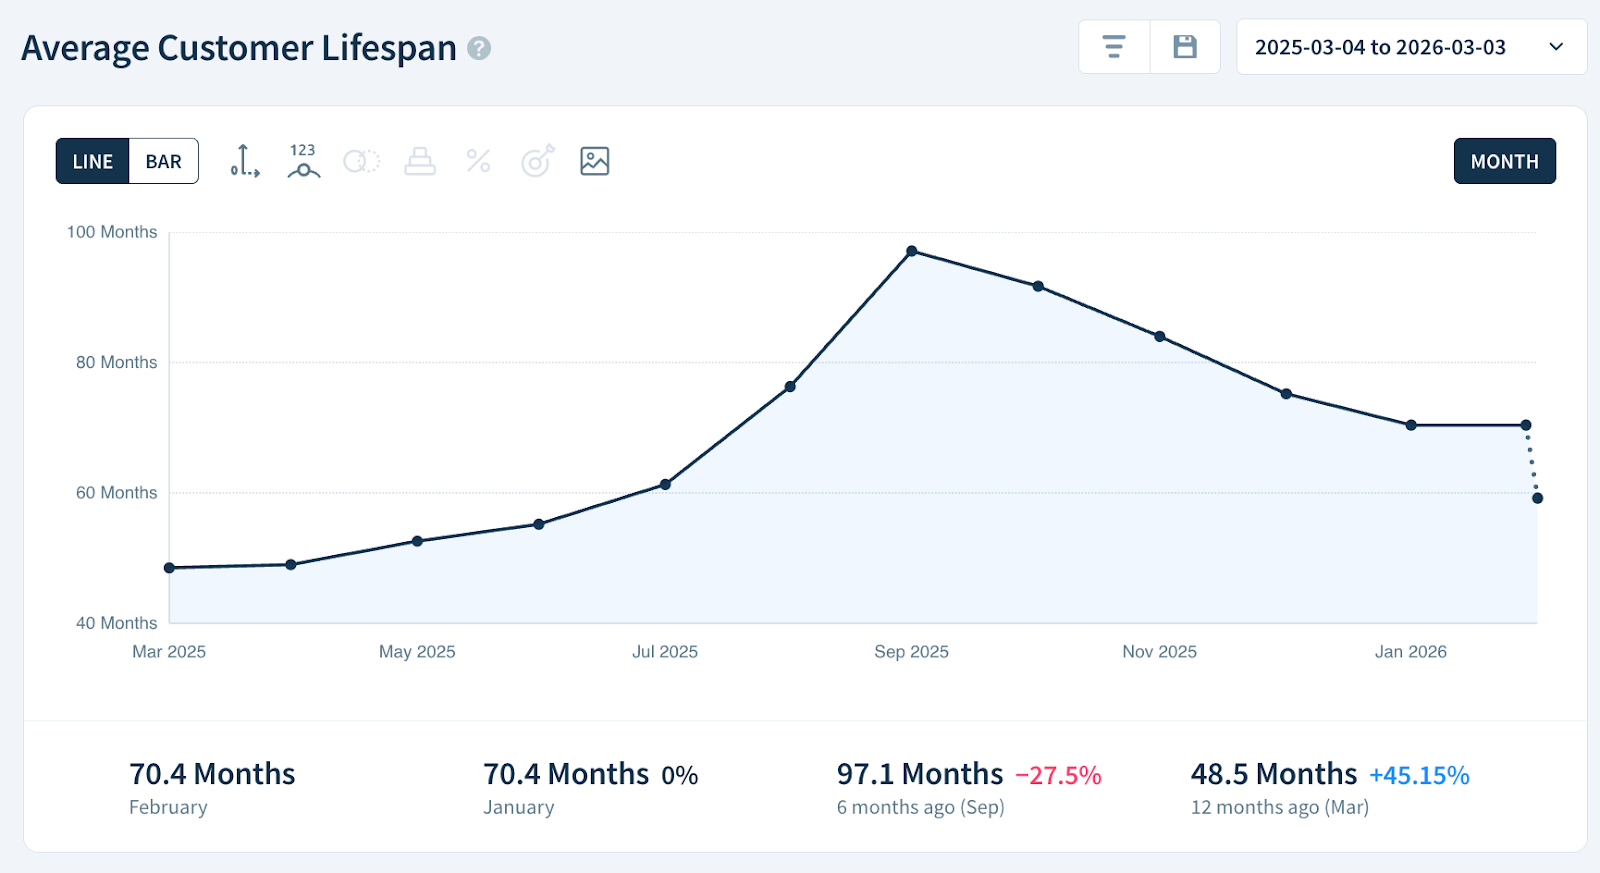
The Average Customer Lifespan chart represents the average time that customers remain subscribed. This metric takes into account paid subscribers only.
For SaaS businesses, it's a key indicator of retention health: the longer the average lifespan, the more revenue you generate per customer and the less pressure there is to constantly acquire new ones.
If you're new to ChartMogul, get to know how charts work.
Average Customer Lifespan vs. Customer Lifetime Value
Average Customer Lifespan and Customer Lifetime Value are related metrics, but they measure different things about the customer relationship:
- Average Customer Lifespan (ACL) is a measure of time: it tells you how long a customer typically remains subscribed to your product or service.
- Customer Lifetime Value (LTV) is a measure of revenue: it estimates the revenue you’ll receive from an average subscriber over their lifetime.
Chart Notes
- This chart is available in monthly intervals only.
Calculation
Average Customer Lifespan is calculated as 1 divided by the six-month trailing average of the Paid Subscriber Churn Rate (the average of the churn rates from the previous six months, excluding the current month).
Chart Data
The Chart Data table for Average Customer Lifespan works differently from other charts. It provides the following breakdown:
- Customer Churn Rate (6/mo avg) — The six-month trailing average of the Paid Subscriber Churn Rate. This is the average of the churn rates from the previous six months, excluding the current month.
- Customer Lifespan — Average Customer Lifespan calculated as 1 divided by Customer Churn Rate (6/mo avg).
- Change — The percentage change in Average Customer Lifespan compared to the previous period.
Next steps
- Segment this chart by plan, region or custom attribute to identify which groups of customers tend to stay subscribed the longest.
- Use Customer Lifetime Value (LTV) to check how much revenue you’re likely to receive from an average subscriber over their lifetime.