
Working with segmentation
Segmentation in ChartMogul lets you filter and group your subscription data to compare metrics — like MRR, LTV, and churn rate — across different subsets of customers, such as by marketing channel, industry, or plan type.
High-level metrics rarely tell the full story. Segmentation surfaces the patterns underneath — showing you which customer types drive the most revenue, where churn is concentrated, and where growth is accelerating.
Segments can be applied to reports, dashboards, maps, cohort analyses, forecasts, and customer lists, and saved for reuse.
Here’s what we cover in this article:
Resources and further reading:
- Introducing Segmentation in ChartMogul
- SaaS Metrics Refresher #9: Segmentation
- Using Deep Customer Segmentation in SaaS
- Find out which animal(s) you’re hunting
Before you begin
Segmentation uses filtering to group customers for analysis. Learn how to work with filters in ChartMogul.
Why Segmentation Matters for Your Metrics
Segmentation lets you go beyond high-level metrics — instead of seeing MRR or churn for all your customers at once, you see it broken down by meaningful groups. For example, analyzing Customer Lifetime Value (LTV — the total revenue you earn from a customer over their lifetime) by marketing channel tells you which channels bring in your best customers, not just any customers.
Segmentation helps you answer questions about your customers, such as:
- Which industry segment generates the highest value customers?
- Which type of customer is most likely to churn?
- In which regions is MRR growing the fastest?
How to Create and Manage Segments
Segments are groups of customers you define that are meaningful to your business and depend on the questions you’re interested in answering.
Creating a segment
To create a segment:
- Add one or more filters to your dashboard, report, map, cohort analysis, forecast or customer list.
- Click the :save-report~gray: Save this segment icon.
- Name your segment and click SAVE.
For example, to create a segment of customers who signed up in the first half of 2025 and have an MRR of $500 or less:
-
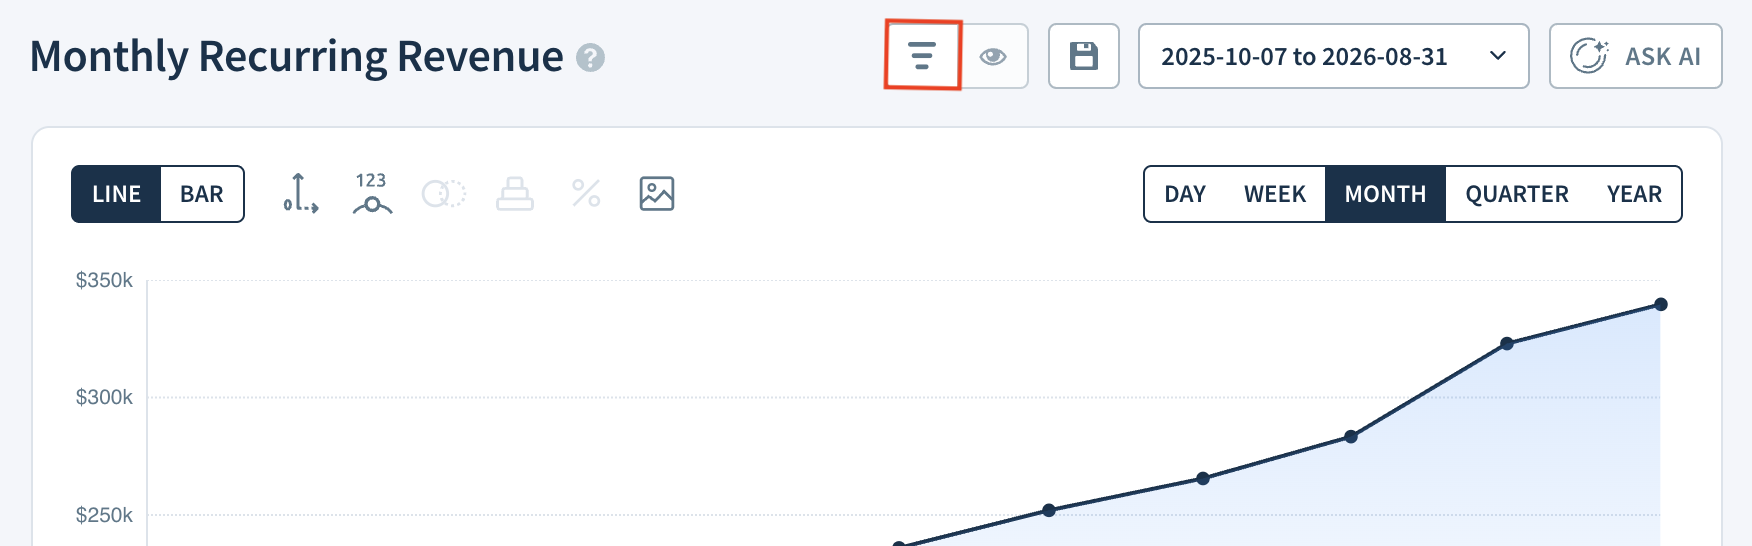
Click the :add-filter~gray: Apply a filter or saved segment button.
-
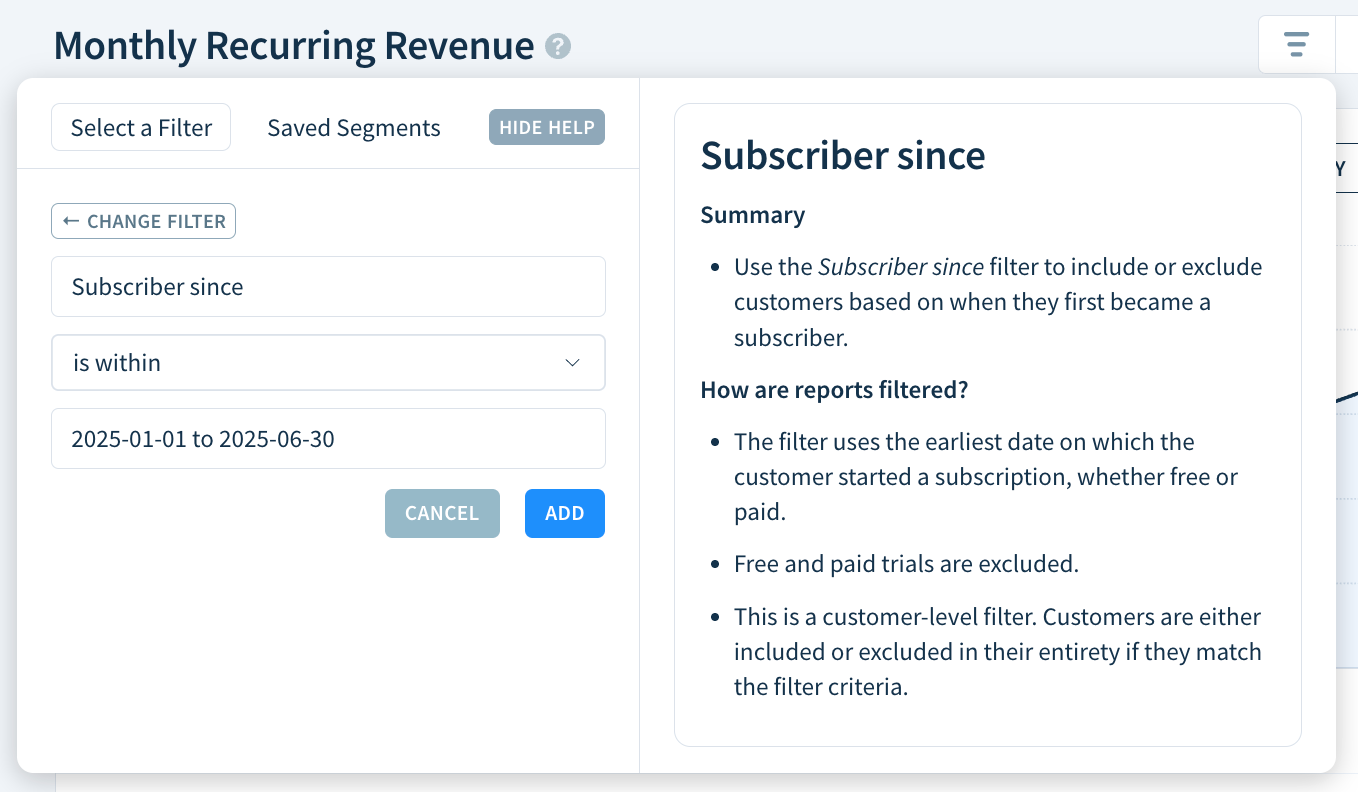
Select Subscriber since from the drop-down, the is within operator, set a date range of 2025-01-01 to 2025-06-30 and click ADD.
Next, click the :add-item~gray: Add a filter to this segment icon to add a second filter. Select Current MRR and is less than or equal to, type 500 in the field and click ADD.
Adding a filter enables the :save-report~gray: Save this segment icon.

Click the :save-report~gray: Save this segment icon, enter a name for the new segment (e.g., Subscribers < $500 Q1-Q2 2025) and click SAVE.

All team members can create segments, but you need to be an Owner, Admin or Staff to save them.
Showing and hiding segments
Click the :font-invisible~gray: Show segments button to reveal any hidden segments. Once shown, segments stay visible everywhere in the app until you click the button again to hide them.

Selecting a segment
Select a segment you’ve previously saved by clicking the :add-filter~gray: Apply a filter or saved segment button and switching to the Saved Segments tab.
The tab shows the segments you’ve previously saved along with several example segments.

ChartMogul applies the segment you select to your analysis. If you have a larger dataset, it may take a moment for ChartMogul to update the dashboard, report, map, cohort analysis, forecast or customer list you’re working with.
Tip: Mouse over a segment to preview the filters inside it.
Comparing segments
Comparing segments is only available with reports.
To compare segments, use the :add-filter~gray: Apply a filter or saved segment drop-down to add new filters or select saved segments.
Use the Compare drop-down to select a value to compare across segments in the Report Data table. Choose from metrics that normally appear as rows in the table for this report type.

Select Show detailed breakdown for each segment to display a full set of metrics for each segment as a separate table.
Your comparison settings are reflected when exporting report data.
Stacking segments
Stacking segments is only available with reports.
Stacking segments shows you how a larger total breaks down across multiple segments — for example, how overall MRR splits between plan types or regions.
To stack segments:
- Find a report in ChartMogul you’d like to work with, such as MRR.
- Next, select or add two or more segments to your report.
-
Now, click the :stack~gray: Stack icon. (This option becomes available once you’ve added at least two segments to the report and the :compare-circle~gray: Compare Segments icon has been selected.)
-
Click the :relative-percentage~gray: 100% Stack icon to show a 100% stacked chart. You can activate this switch without clicking the :stack~gray: Stack icon first.
-
Change the graph type and interval to further adjust your report.
Duplicating segments
Create a copy of a segment by clicking the :duplicate-segment~gray: Duplicate segment icon. Then, edit the segment as needed.

Reordering segments
Reordering segments only impacts reports.
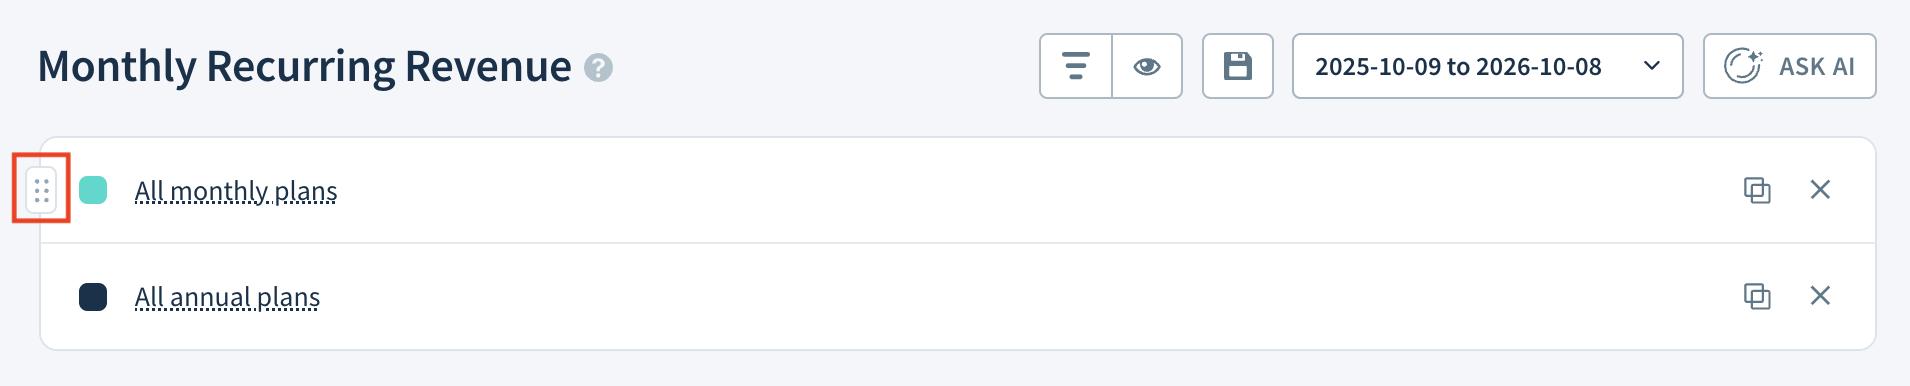
Hover over the segment to reveal a drag handle. Click and drag the handle to change the order or position of a segment in your report.
Closing segments
Remove a segment from your analysis by clicking the :close-segment~gray: Close segment icon.

Deleting segments
To delete a segment you’ve previously saved, click the :add-filter~gray: Apply a filter or saved segment button and switch to the Saved Segments tab. Hover over the segment and click the :trash-stroke~gray: trashcan icon next to its name. Confirm by clicking OK.

Using color labels with segments
Color makes it easier to compare segments visually. Assign a color by clicking the color tile next to the segment’s name and selecting a color.

Managing saved segments
Go to Settings > Manage > Segments to view and manage saved segments added by you and your team members.
You can also get there from any report, dashboard, or customer list by opening the Apply a filter or saved segment drop-down, switching to Saved Segments, and clicking MANAGE SEGMENTS.
The page lists all saved segments with the following details:
- Name – the segment’s name. Hover to show the filters used in the segment.
- Referenced by – information about any saved reports and customer lists that use the segment. Hover to see the exact reports and customer lists.
- Last updated – the time the segment was last changed.
- Updated by – the team member who last changed the segment.

Reordering saved segments
Hover over a segment to reveal the reorder handle. Click and drag the handle to move the segment up or down the list — a grey indicator line shows where the segment will land when you drop it.
The order you set here is the order in which segments appear when you apply a saved segment elsewhere in ChartMogul.
How to rename a saved segment
To rename a saved segment, click the Rename segment icon on its row. Enter a new Name and click SAVE.
Deleting a saved segment
Deleting a saved segment can’t be undone. Before deleting a segment, check the Referenced by column to ensure the segment is not used by any saved reports or customer lists.
To delete a saved segment, click the :trash-stroke~gray: Delete segment icon on its row, then click OK to confirm.
Next steps
- Learn about working with reports
- Follow our tutorial on segmenting churn by early product adoption
- Learn how to segment MRR by marketing channel