
Report: Quantity Churn Rate
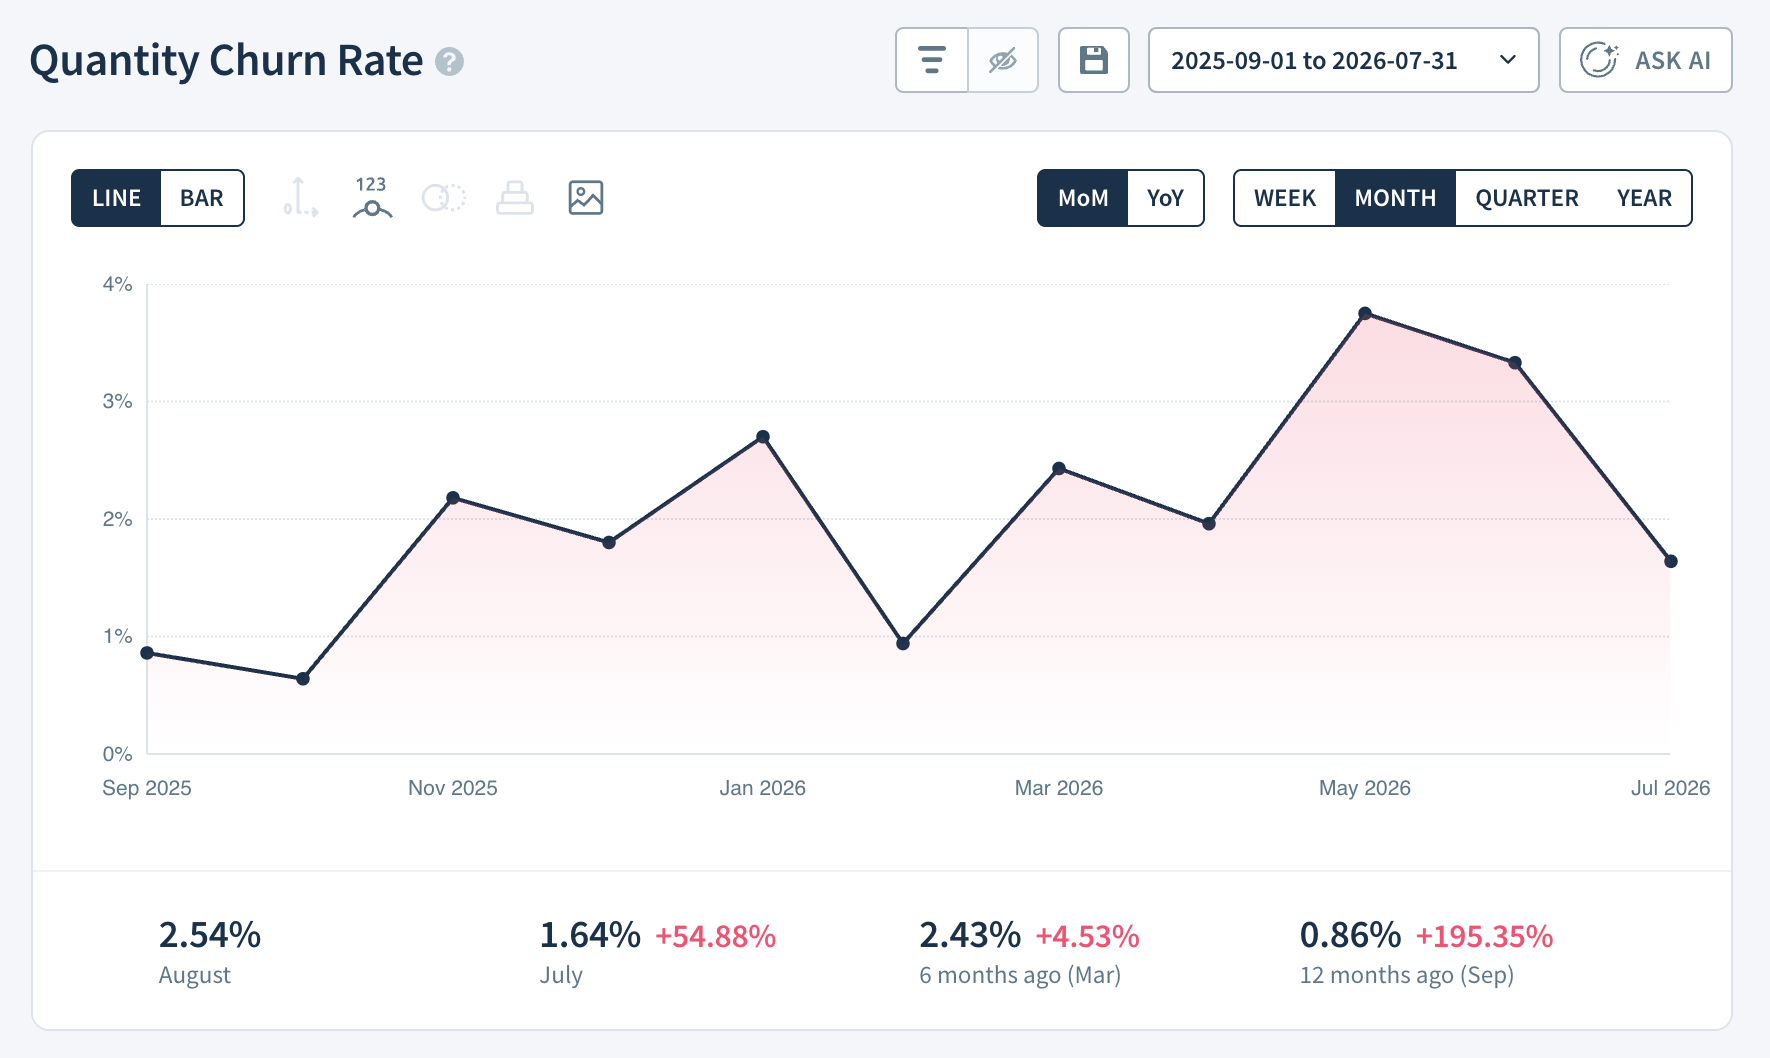
The Quantity Churn Rate report displays the rate at which you're losing subscription seats or licenses — not just whole subscriptions.
If you sell individual licenses or seats, this report tracks the loss of those units specifically. If you don't, it tracks the rate at which you lose whole subscriptions.
Subscriptions vs. Subscription Quantity
If your company sells individual licenses or seats, it’s important to understand the difference between Subscriptions and Subscription Quantity.
Subscriptions are specific instances of plans your customers have subscribed to, whereas Subscription Quantity is the number of these subscriptions.
For example, Syncalytics subscribes to four Gold plans and five Silver plans. They have two subscriptions (1 × Gold + 1 × Silver) with a subscription quantity of nine (4 × Gold + 5 × Silver).
If your company doesn’t sell licenses or seats (or your billing system doesn’t support subscription quantities), then Quantity Churn Rate will represent the rate at which you lose whole subscriptions.
What to Know About This Report
- ChartMogul uses
Quantityfrom an invoice line item or manual subscription to define a subscription’s quantity. Learn more about invoice line items. - Familiarize yourself with the Churn Rate Formula and Churn Recognition settings in ChartMogul and make sure these are configured to support your needs.
- Review how ChartMogul handles contraction and churn in the lifecycle of a subscription.
- Toggle between the default (WoW/MoM/QoQ) and year-over-year (YoY) rates. Learn more.
How ChartMogul Calculates Quantity Churn Rate
On August 15, 2022 we retired the Churn Rate Formula setting. Accounts opened prior to this date that had selected the Shopify formula can continue to configure this setting. All other accounts, including new accounts opened on or after August 15, 2022 use the standard formula.
Standard Formula (B2B)
Formula

Example
Your customers start the month with ten active subscriptions. You lose two during the month: one from an existing customer, one from a new customer who subscribed that month. Only the existing customer's cancellation counts toward churn, so your quantity churn rate is 10%: 1 ÷ 10.
Shopify Formula (B2C)
Formula

Example
At the start of Monday, you have 100 active subscriptions. That day, you lose five subscriptions. The next day, you gain another ten but lose five, leaving you with 100 subscriptions at the end of Tuesday.
The quantity churn rate for this period is the sum of each day’s quantity churn rate:
- Monday’s quantity churn rate: (100 − 95) ÷ 100 = 5%
- Tuesday’s quantity churn rate: (95 − 100) ÷ 95 = −5.26%
The quantity churn rate for Monday – Tuesday is −0.26%. A negative quantity churn rate indicates you’re gaining new subscriptions faster than losing them.
How ChartMogul estimates churn for the current period
For periods that haven’t ended yet, ChartMogul estimates the final churn rate using this formula:
(total number of days in the period ÷ number of days passed in the period) × real churn rate
How to Read the Report Data Table
The Report Data table — the detailed data grid below the report — works differently for Quantity Churn Rate than for other reports. It breaks down your churn into three columns:
- Quantity Decrease — The quantity of subscriptions canceled in the period.
- Subscriptions Quantity — The quantity of subscriptions at the end of the period.
- Quantity Churn Rate — The calculated churn rate for the period.
Select a Quantity Decrease cell to see a complete list of churn activities.
Next Steps
- Use the Subscription Quantity report to view the total number of active subscriptions by number of licenses or seats.
- Learn more about other churn rate reports.
- See which subscriptions are scheduled to churn with CMRR.