
Chart: Paid Subscriber Growth Rate
The Paid Subscriber Growth Rate chart shows the percentage change in your active paid subscriber count from one period to the next.
For SaaS businesses, it's one of the clearest indicators of business momentum. Consistent growth signals that new customer acquisition is outpacing churn, while a declining rate can indicate retention or conversion problems. Tracking it over time helps you measure the effectiveness of growth initiatives and spot trends before they impact revenue.
If you're new to ChartMogul, get to know how charts work.
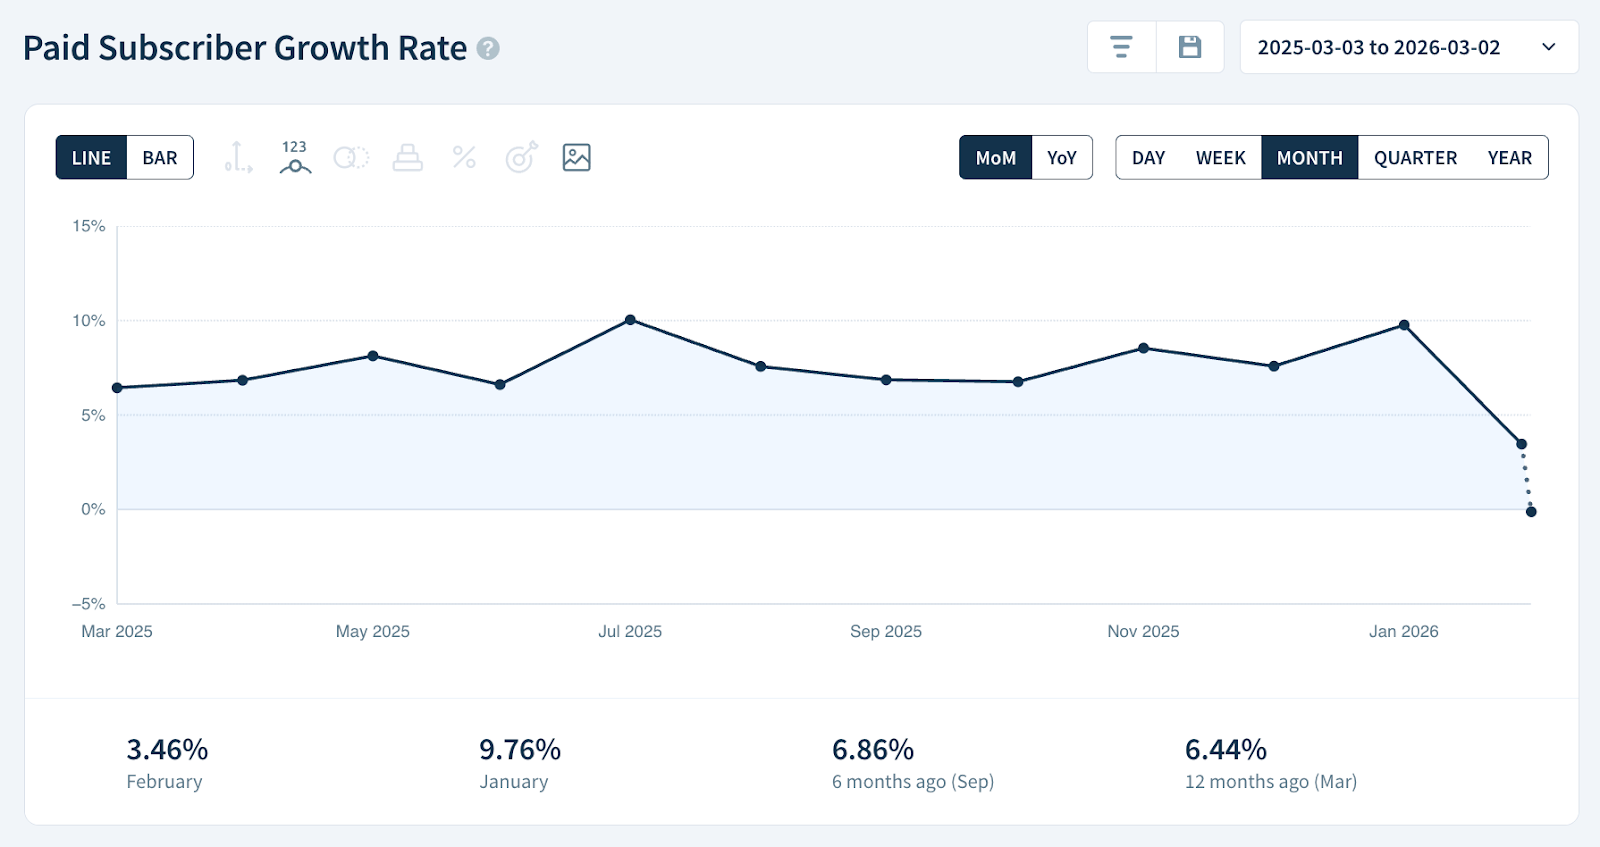
Chart Notes
- Toggle between the default (DoD/WoW/MoM/QoQ) and year-over-year (YoY) rates. Learn more.
Calculation
ChartMogul calculates Paid Subscriber Growth Rate as the percentage change in active paid subscriber count from one period to the next:
(Subscribers this period − Subscribers previous period) ÷ Subscribers previous period × 100
Chart Data
The Chart Data table for Paid Subscriber Growth Rate works differently from other charts. It provides the following breakdown:
- Subscribers — The total number of active paid subscribers in the period.
- Paid Subscriber Growth Rate — The percentage change in total active paid subscribers compared to the previous period.
- Change — The percentage change in Paid Subscriber Growth Rate compared to the previous period.
Next steps
- Use Subscriber Movements to see fluctuations in paid subscribers over time.
- Use segmentation to analyze Paid Subscriber Growth Rate by region, plan or custom attribute.