
Chart: Subscription Movements
Subscription Movements visualizes the positive and negative fluctuations in both paid and free subscriptions. Movements for each period are displayed as vertically stacked, color-coded bands representing new and canceled subscriptions.
For SaaS businesses, it provides an at-a-glance view of subscription momentum, making it easy to spot trends, seasonal patterns, and the impact of product and pricing changes over time.
If you're new to ChartMogul, get to know how charts work.
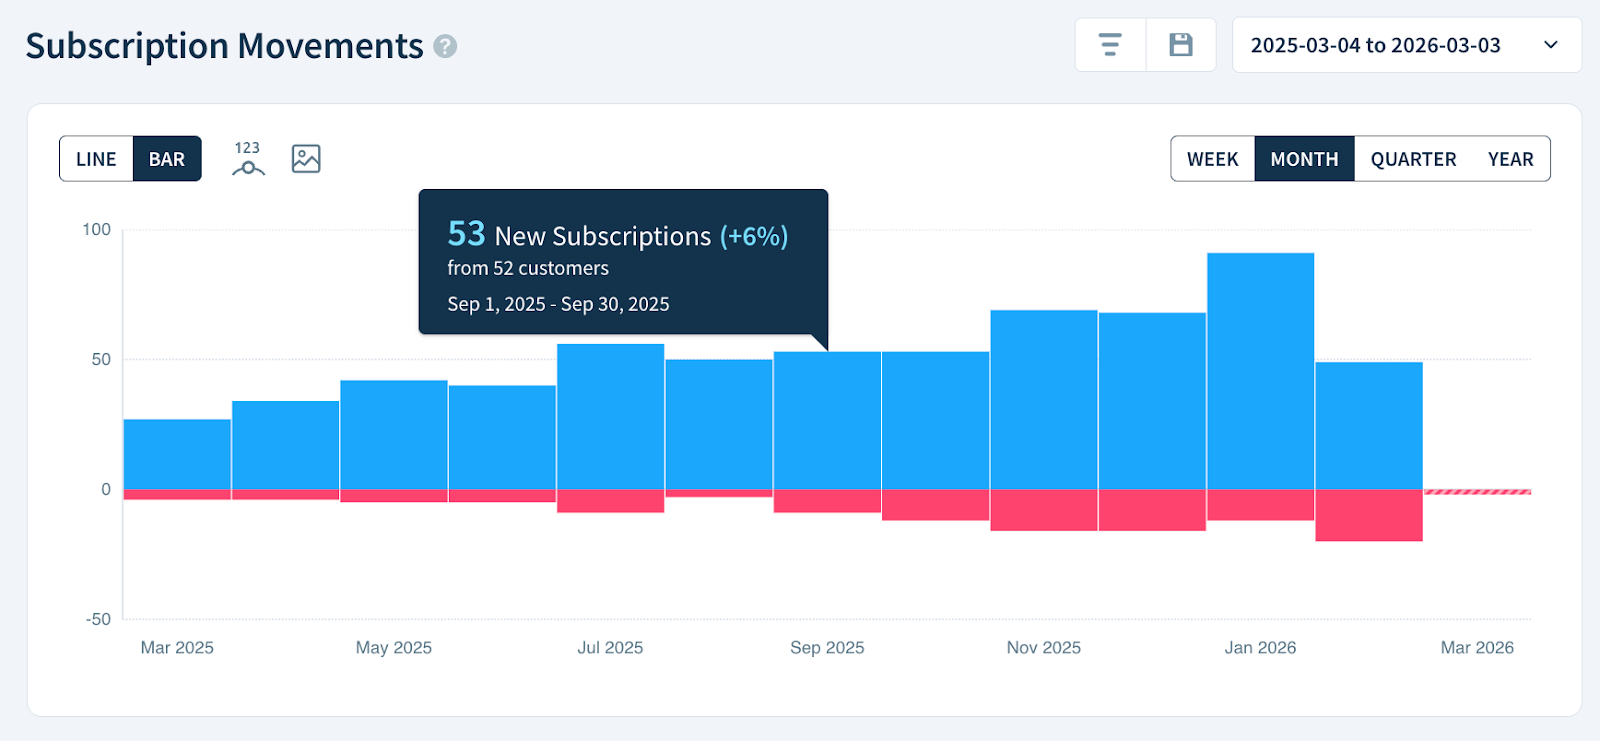
Chart Notes
- Each vertically stacked band represents a specific subscription movement type: New Subscriptions are blue, while Cancelled Subscriptions are pink.
- Multi-component subscription sets are counted as a single subscription, regardless of the number of individual components within the set.
Free subscriptions
This chart is only available for accounts with free subscription and trial line item support. We introduced this functionality on October 2, 2025 and are gradually making it available to all accounts.
Calculation
ChartMogul counts the number of new and canceled subscriptions in each period. Multi-component subscription sets are counted as a single subscription.
Isolating movements
Click the eye icon in the Chart Data table to show or hide the individual subscription movement types.
Chart Data
The Chart Data for Subscription Movements works differently from other charts. It provides the following breakdown:
- New Subscriptions — The number of paid and free subscriptions started in the period.
- Cancelled Subscriptions — The number of paid and free subscriptions canceled in the period.
- Net Subscription Movement — The net gain or loss of paid and free subscriptions in the period.
- Change — The percentage change in paid and free subscriptions compared to the previous period.
- Total Subscriptions — The total number of paid and free subscriptions in the period.
Next steps
- Use segmentation to visualize fluctuations in subscriptions by region, plan or custom attribute such as industry or marketing channel.
- Use Subscriber Movements to visualize fluctuations in paying subscribers over time.