
Working with filters
Filters in ChartMogul let you narrow your analysis to a specific subset of your data by combining an attribute, an operator, and a value. They work with dashboards, charts, maps, cohort analyses, forecasts, and customer lists. They’re also core to segmentation.
Here are some example uses of filters in ChartMogul Subscription Analytics and CRM:
- Tracking the development of MRR for a specific plan (or set of plans) over time
- Calculating average revenue by account (ARPA) for a particular region
- Analyzing churn rates by industry segment or vertical
- Prioritizing your sales activities by identifying leads with open tasks
- Comparing the average sales cycle length across sales representatives
Here’s what we cover in this article:
How filters work
Filters are like math equations. They define the logic that ChartMogul uses to narrow the focus of your analysis. Each filter consists of an attribute, an operator, and a value (or range of values).
Here are a few examples:
| Attribute | Operator | Value(s) |
|---|---|---|
| Region | is one of | Canada |
| MRR (Current) | is less than | $100 |
| Subscriber since | is within | 2022-04-01 to 2022-06-30 |
Attributes
Attributes are pieces of information or data that ChartMogul stores for each customer in addition to the customer, subscription, and billing data it retrieves from an integration.
There are two main types of attributes in ChartMogul:
- Standard attributes that complement and extend your subscription data for use with filtering and segmentation.
- Custom attributes you create or those ChartMogul may create to store additional data imported from your billing system.
Review our comprehensive resource on ChartMogul filters and their behaviors.
Standard attributes
ChartMogul offers the following attributes out of the box.
Click an attribute name in the table below to open a page with its detailed description. Note that the table includes some new filters that aren’t available to all customers yet.
The Filter level column shows whether a filter applies at the customer or subscription level. Learn more.
| Attribute | Type | Filter level |
|---|---|---|
| # of active subscriptions | Number | Customer |
| # of Contacts | Number | Customer |
| Average order value | Number | Customer |
| Cancellation scheduled for | Date | Customer or subscription |
| Churned | Date | Customer or subscription |
| Currency | Currency | Customer or subscription |
| Customer | Customer | Customer |
| Customer since | Date | Customer |
| Didn’t cancel within N days of purchase | Number | Customer |
| Free subscriber status | Customer status | Customer |
| Free trial started at | Date | Customer |
| Has discount | Boolean | Customer or subscription |
| Has open task | Boolean | Customer |
| Has opportunity | Boolean | Customer |
| Last active at | Date | Customer |
| Last communication at | Date | Customer |
| Last email received from customer at | Date | Customer |
| Last email sent to customer at | Date | Customer |
| Last payment | Date | Customer |
| Lead created at | Date | Customer |
| Lead status | Customer status | Customer |
| MRR (at time of purchase) | Number | Customer |
| MRR (Current, or at time of cancellation) | Number | Customer |
| MRR (Current) | Number | Customer |
| MRR contracted | Date | Customer or subscription |
| MRR expanded | Date | Customer or subscription |
| Net payments | Number | Customer |
| Next payment | Date | Customer |
| Number of successful payments | Number | Customer |
| Owner | Team member | Customer |
| Paid subscriber since | Date | Customer |
| Paid subscriber status | Customer status | Customer |
| Paid subscription quantity | Number | Customer or subscription |
| Paid subscription quantity before churn | Number | Customer or subscription |
| Past due date | Date | Customer or subscription |
| Plan | Plan | Subscription |
| Plan (at subscription start) | Plan (at subscription start) | Subscription |
| Plan (at time of first purchase) | Plan (at time of first purchase) | Customer |
| Plan (during trial) | Plan during trial | Subscription |
| Plan (including all items in subscriptions set) | Plan (including all items in subscriptions set) | Subscription |
| Reactivated | Date | Customer or subscription |
| Region | Region | Customer |
| Renewal date | Date | Customer or subscription |
| Source | Source | Customer or subscription |
| Subscriber since | Date | Customer |
| Tags | Tag | Customer |
| Trial status | Customer status | Customer |
| Trial-to-conversion in days | Number | Subscription |
| Trial-to-paid in days | Number | Subscription |
| Website | String | Customer |
New filters
On October 2, 2025, we introduced new filters and are making them gradually available to all customers:
- Plan (during trial) — Customer’s plan during their trial.
- Plan (at subscription start) — Customer’s plan at the start of their free or paid subscription. Unlike Plan (at time of first purchase), the filter isn’t fixed to the customer’s first subscription purchase.
- Trial-to-conversion in days — Number of days between trial start and the start of a paid or free subscription.
- Subscriber since — Date when the customer became a free or paid subscriber for the first time.
The filters are part of an update that improves subscription and trial handling. Other changes include a new “trial” line item type and improvements to the Subscriptions and Subscription History tables on customer records.
Custom attributes
ChartMogul allows you to create custom attributes to store additional information or data for each customer, contact, opportunity, or subscription. ChartMogul also creates custom attributes to store additional data imported from certain integrations. You can filter by customer and subscription custom attributes.
Learn more about custom attributes.
Operators
The operator determines the logic of the filter, i.e., how ChartMogul uses the attribute you’ve selected and the value (or range of values) you’ve entered to limit which data is included in your analysis.
The operators available depend on each attribute’s type:
- Boolean — is true, is false, is present, is not present, is true or not present, is false or not present
- Date — is on, is after, is before, is on or after, is on or before, is within, is present, is not present
- Number — equals, does not equal, is less than, is more than, is less than or equal to, is more than or equal to, is between, is present, is not present
- Currency, Source — is one of, is none of, has all of
- Customer, Customer status — is one of, is none of
- Has discount, Has open task, Has opportunity — is true, is false
- Owner, Region — is one of, is none of, is present, is not present
- Plan — see plan filters
- Plan (during trial), Plan (at subscription start) — was one of, was none of, was any plan
- Plan (including all items in subscription set) — is one of, is none of, has all of, is present, is not present
- Plan (at time of first purchase) — was one of, was none of
- String — is, is not, contains, does not contain, is present, is not present, is one of, is none of
- Tags — is one of, is none of, has all of, is present, is not present
Filter levels
Filters can apply at the customer or subscription level, determining what data are included in your reports:
- Customer level – targets entire customers. If a customer matches the filter criteria, all of their subscriptions are included.
- Subscription level – returns only the subscriptions that match the filter criteria. When used with customer reports, a customer is included if any of their subscriptions match the filter.
For some filters, you can choose whether to apply them at the customer or subscription level. When a filter supports both levels, a drop-down appears at the top of the filter panel. Click it to switch between Customer Level and Subscription Level.
Review the standards attributes table to check which levels are available for each filter.
Adding a filter
To add a filter to your dashboard, chart, map, cohort analysis, forecast, or customer list:
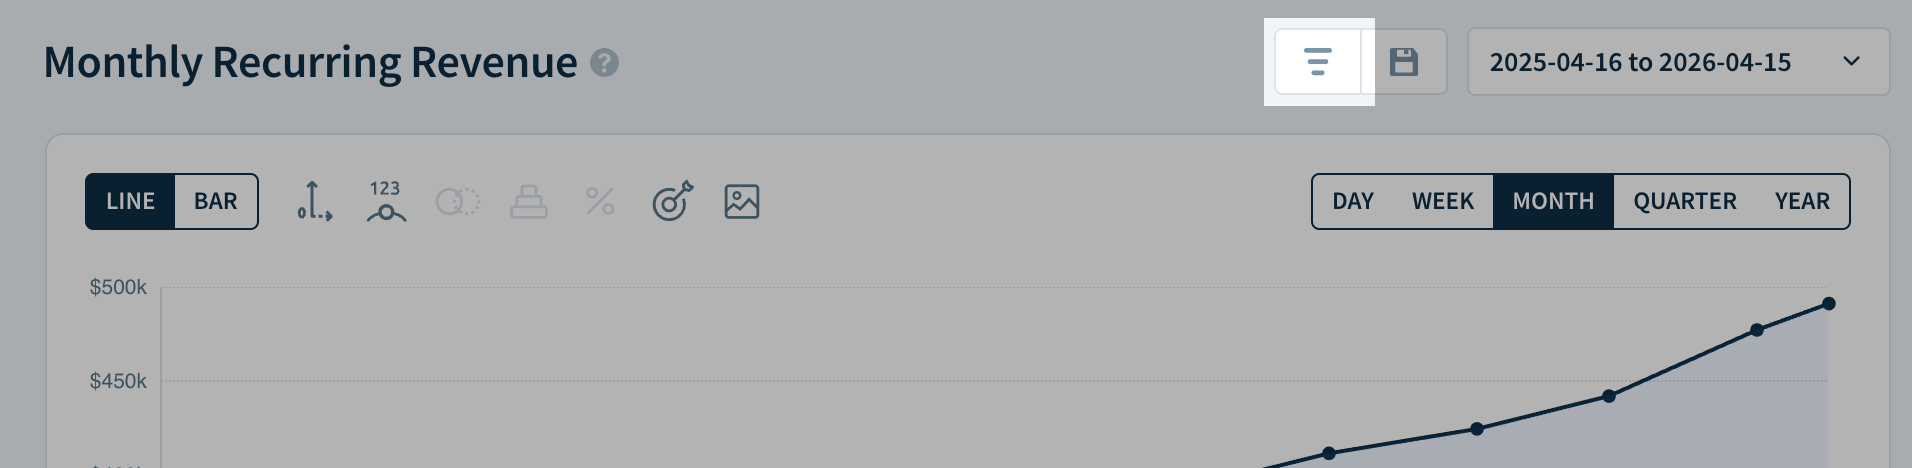
-
Click the Apply a filter or saved segment button.
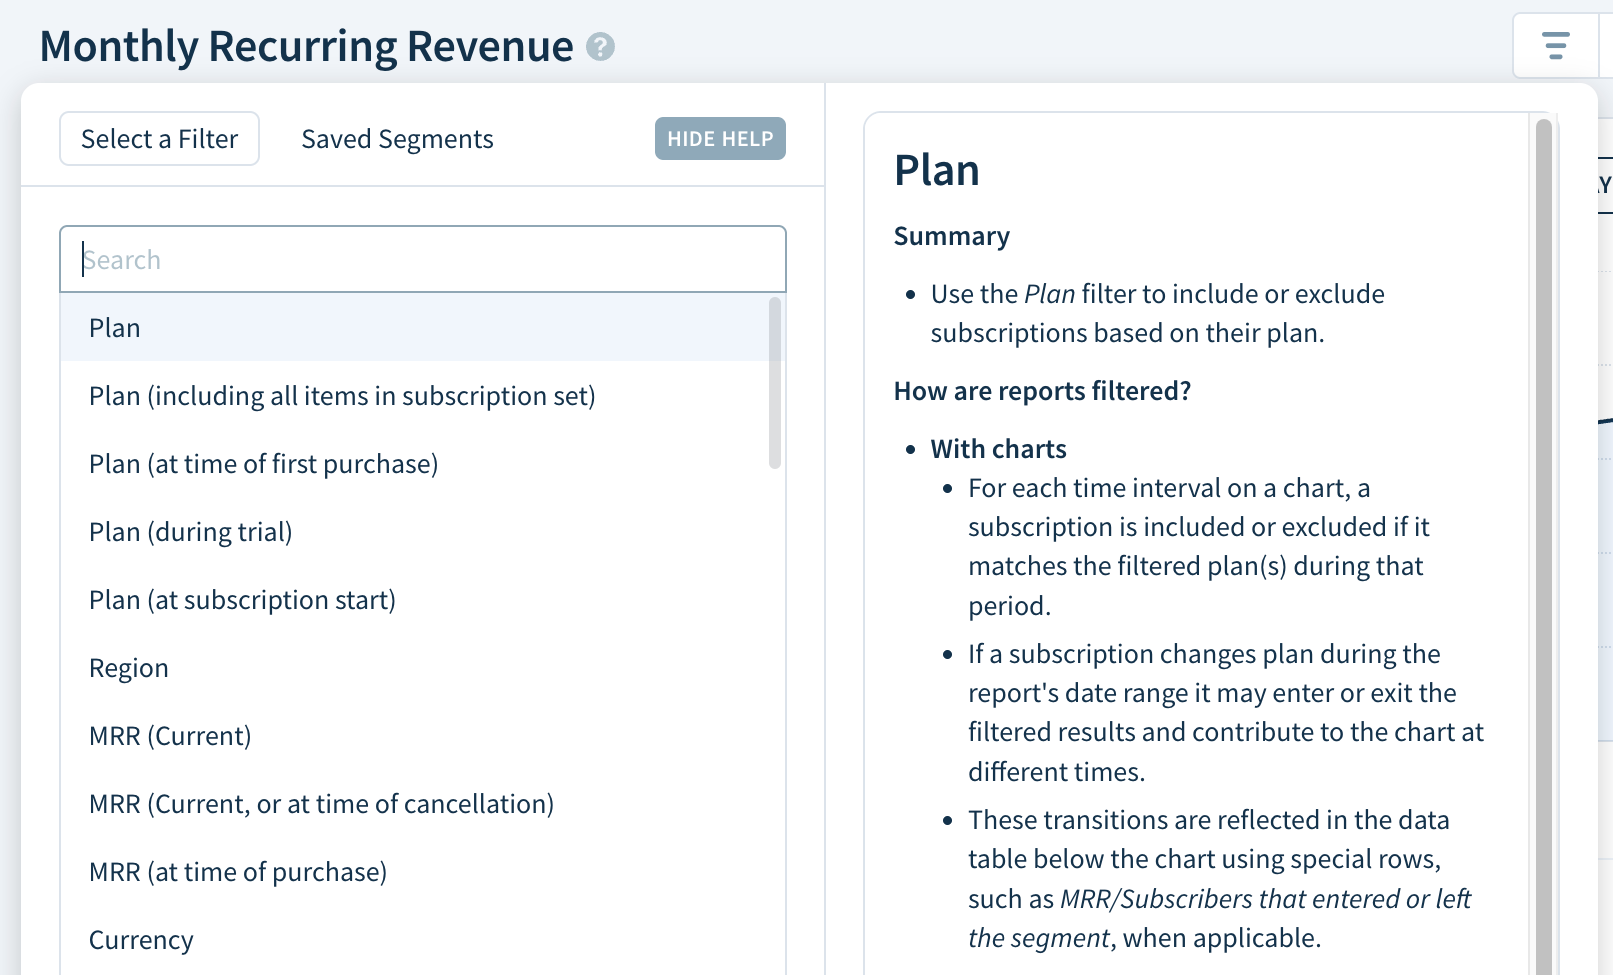
-
Select an attribute from the list. Hover over an attribute to see its detailed description. Click CHANGE FILTER to change your selection.
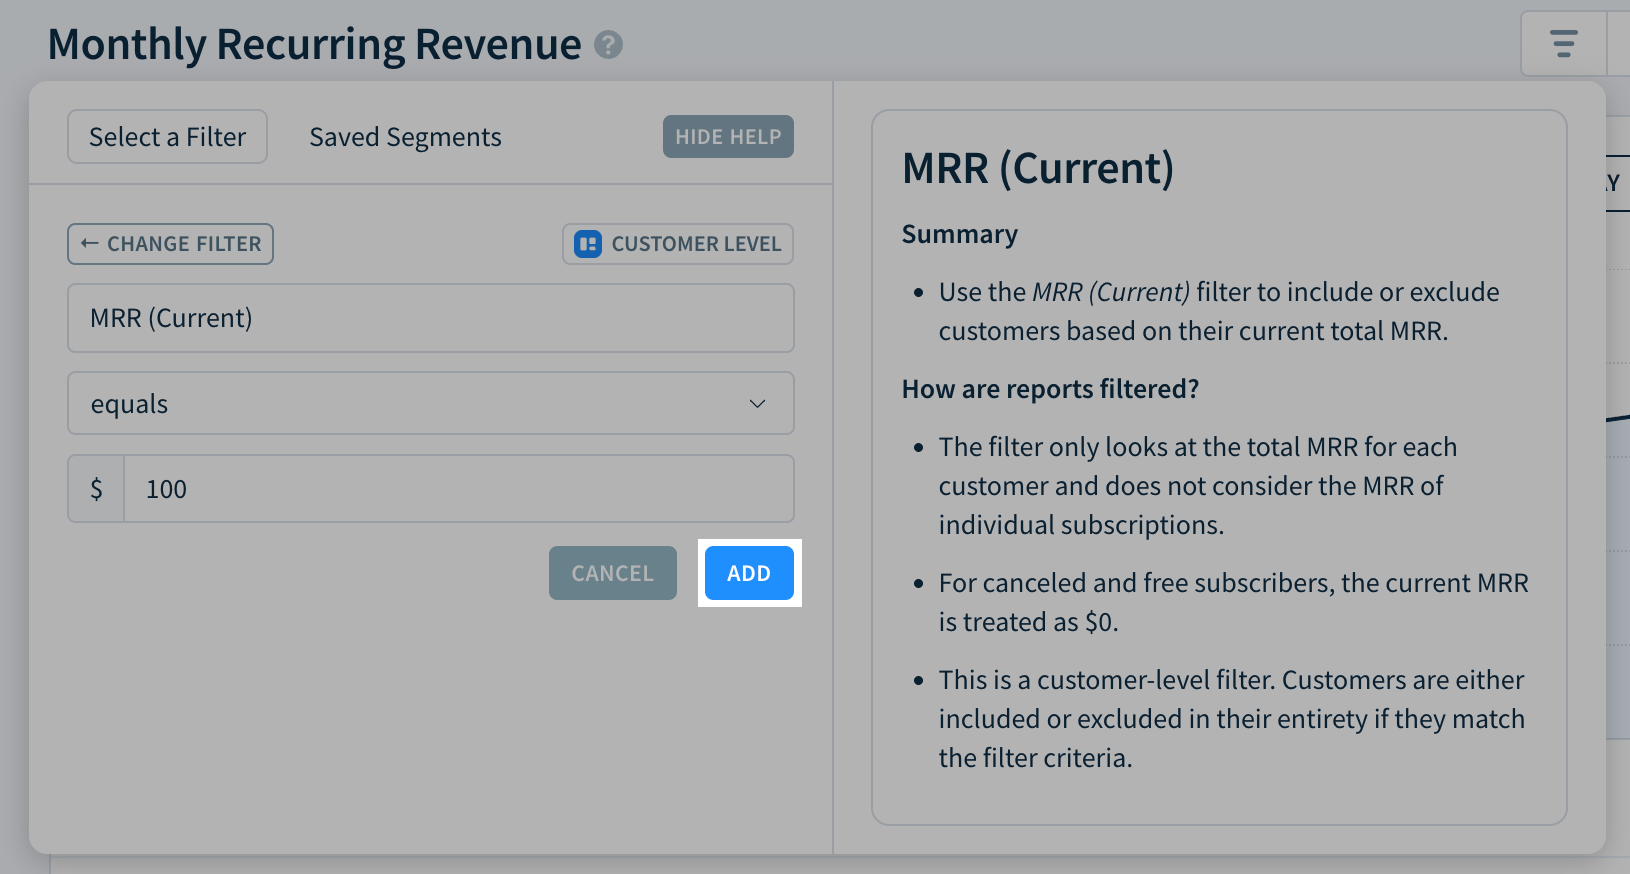
- If the filter supports it, use the drop-down to choose between Customer Level and Subscription Level. Learn more.
- Select an operator from the drop-down.
- Enter an appropriate value (or range of values) in the field provided.
- Click ADD to apply your filter.
-


Combine filters to narrow down your results. Click the plus sign button and repeat the previous steps to add more filters until you’ve isolated the data you want.
By default, ChartMogul connects filters using the AND operator. To switch to OR, hover over the plus sign button and select OR from the dropdown. To change an existing operator, click it and select a new one. ChartMogul automatically adds parentheses where needed to prevent ambiguity.

Filters remain active across ChartMogul until you remove them.
Updating a filter
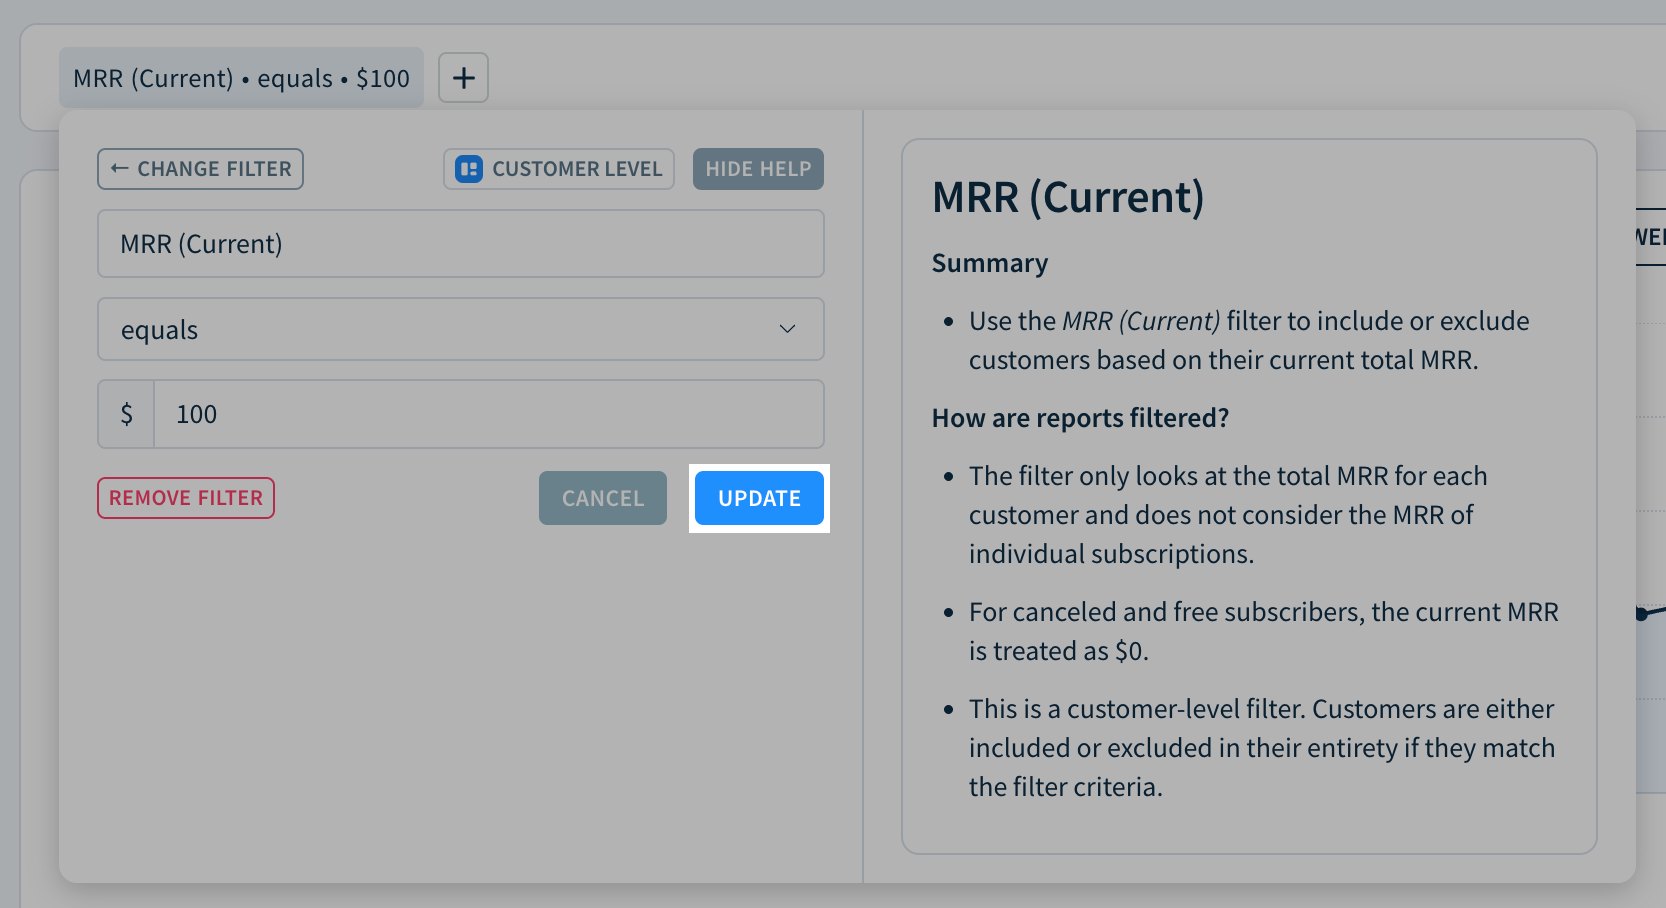
- Click the filter you’d like to update.
- Adjust the filter’s level, attribute, operator, and/or values.
-
Click UPDATE.

Removing a filter
- Click the filter you’d like to remove.
- Click REMOVE FILTER.
Next Steps
- Use filters to segment a chart by region, currency, or plan.
- Create a plan group.