How ChartMogul calculates Scenarios
Scenarios generate projections of your paid subscriber count and annual run rate (ARR) through a structured calculation process. Learn how ChartMogul transforms your historical data and “what if” inputs into projected metrics.
Before you begin
Learn how to use and analyze Scenarios.
Historical averages
ChartMogul retrieves the following data from your selected historical window (the last three, six or nine months) and calculates monthly averages for the period:
- Trial count — the number of free trials
- Subscriber counts — the number of paid subscribers, in total and per MRR movement category
- MRR — monthly recurring revenue, in total and per MRR movement category
MRR movement categories include new business, expansion, contraction, churn and reactivation.
Based on the above, ChartMogul calculates the following monthly averages for the period:
- Conversion rate — new business subscriber count divided by trial count (how many free trials of a given month convert to paying subscribers)
- Average sale price (ASP) — new business MRR divided by new business subscriber count
- Subscriber percentages for each MRR movement category — for example, expansion subscriber count divided by total subscriber count
- MRR movement per subscriber for each MRR movement category — for example, churn MRR divided by churned subscriber count
ChartMogul also records the total MRR and total subscriber count at the start of the analysis and uses these values to calculate average revenue per account (ARPA) (total MRR divided by total subscriber count).
Inputs
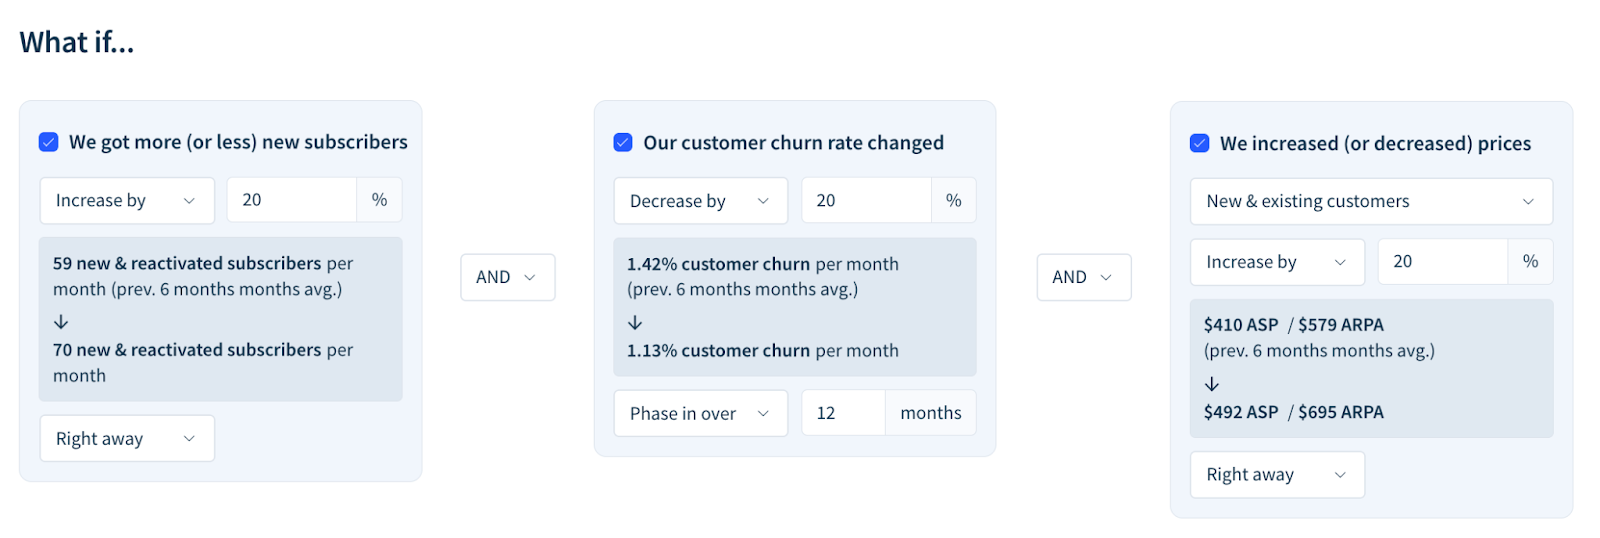
ChartMogul asks you for the following inputs, each representing a different “what if” scenario for your projections (for example, “what if we got 20% more new subscribers each month”):
- New subscriber count change — the overall percentage change in new and reactivated subscriber counts per month
- Customer churn rate change — the overall percentage change in the monthly customer churn rate
- Price change — the overall percentage change in prices, affecting ASP if you apply it to new customers only, or both ASP and ARPA if you apply it to new and existing customers
For each type of change, you also define a phase-in period — the number of months over which the change will be applied. If you choose to execute a change right away, its phase-in period equals one. That’s because the change will be applied in the next month.
You can group multiple changes into a single scenario to see their combined effect (the AND drop-down option) or analyze each change individually (the OR option).
ChartMogul uses your inputs to calculate:
- ASP change — the overall change in average sale price
- ARPA change — the overall change in average revenue per account
Each change is divided by its phase-in period to determine monthly changes during the period:
- New subscriber count change
- Customer churn rate change
- Price change for new and reactivated subscribers
- Price change for all subscribers
Let’s say you’re currently getting 500 new subscribers per month, and you want to test a scenario where the number increases by 10%. In this case, the overall new subscriber count change is 50 (10% of 500).
If you apply the change right away, the phase-in period equals 1. So the new subscriber count change per month equals 50 (50 divided by 1) and is only applied in month 1.
If you phase the change over 10 months, the new subscriber count change per month equals 5 (50 divided by 10) and is applied in months 1 to 10.
See the two scenarios compared in the table below.
|
|
Month 0 | Month 1 | Month 2 | Month 3 | … | Month 9 | Month 10 | Month 11 |
|---|---|---|---|---|---|---|---|---|
| Right away | 500 | 550 | 550 | 550 | … | 550 | 550 | 550 |
| Phase in over 10 months | 500 | 505 | 510 | 515 | … | 545 | 550 | 550 |
Projections
ChartMogul calculates projections month by month, starting with subscriber counts and then using them to determine MRR.
Subscriber projections
ChatMogul projects subscriber counts for each month based on the last month’s subscriber count and the following historical averages:
- Trial count — the number of free trials
- New business subscriber count — trial count multiplied by conversion rate
- Expansion percentage — expansion subscriber count divided by total subscriber count
- Contraction percentage — contraction subscriber count divided by total subscriber count
- Churn percentage — churned subscriber count divided by total subscriber count
- Reactivation percentage — reactivated subscriber count divided by total subscriber count
For new business subscribers, ChartMogul starts with the historical average new business subscriber count, then adjusts it for any change in new business subscribers resulting from the “what if” inputs:

For expansion, contraction and reactivated subscribers, ChartMogul multiplies the latest (last month’s) subscriber count by the historical average subscriber percentage for the movement type. For example, reactivated subscriber counts are calculated as:

For churned subscribers, ChartMogul additionally accounts for any change in churned subscribers resulting from the “what if” inputs:

When projecting the total subscriber count for each month, ChartMogul adds new business and reactivated subscribers to the latest (last month’s) subscriber count and subtracts churned subscribers:
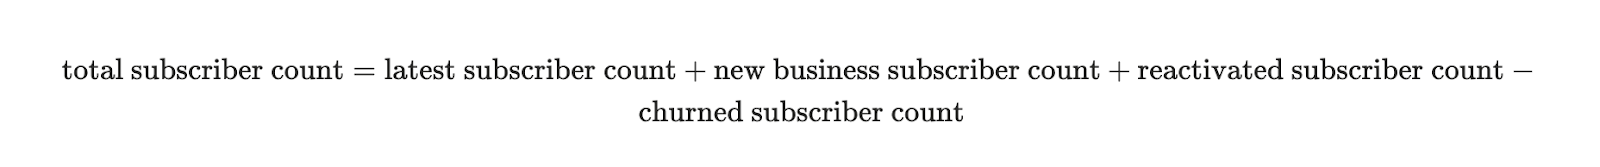
The calculation ignores expansion and contraction subscribers, as they don’t affect the total subscriber count.
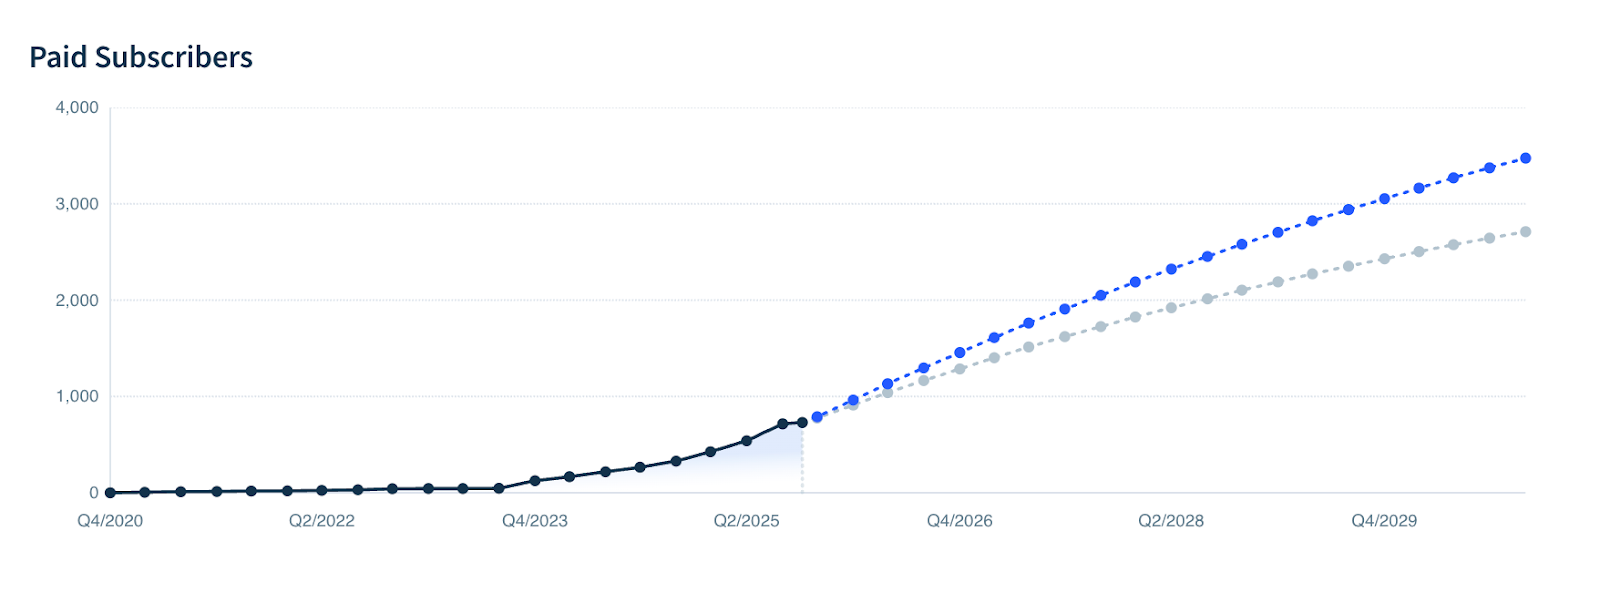
ChartMogul shows the projected monthly subscriber counts on the Paid Subscribers chart.
MRR projections
ChartMogul projects MRR for each month using projected subscriber counts, initial ARPA (total MRR divided by total subscriber count) and the following historical averages:
- ASP — new business MRR divided by new business subscriber count
- Expansion per subscriber — expansion MRR divided by expansion subscriber count
- Contraction per subscriber — contraction MRR divided by contraction subscriber count
- Churn per subscriber — churn MRR divided by churned subscriber count
- Reactivation per subscriber — reactivation MRR divided by reactivated subscriber count
For new business MRR, ChartMogul takes into account the projected new business subscriber count, historical average ASP and any change in ASP resulting from the “what if” inputs:

For expansion MRR, ChartMogul takes into account the projected expansion subscriber count, historical average expansion per subscriber and any change in ARPA resulting from the “what if” inputs:

The projections of contraction MRR are analogous to those of expansion MRR:

For churn MRR, ChartMogul takes into account the projected churned subscriber count, historical average churn per subscriber and the ratio of the latest (last month’s) ARPA and average ARPA:

For reactivation MRR, ChartMogul takes into account the projected reactivated subscriber count, historical average reactivation per subscriber and any change in ASP resulting from the “what if” inputs:

The projection of total MRR is split into two components:
- Pre-change MRR — This represents the “legacy” MRR from your original subscriber base that decays over time due to churn. It starts at your initial MRR and shrinks each month as churned customers take their proportional share of this pool with them.
- Post-change MRR — This represents the “new” MRR accumulated from new business, expansion and reactivation and reduced by churn and contraction.
To calculate pre-change MRR, ChartMogul uses the latest (last month’s) pre-change MRR (or starting MRR for month 1), the latest (last month’s) total MRR, the projected churn MRR for the month and any change in ARPA resulting from the “what if” inputs:

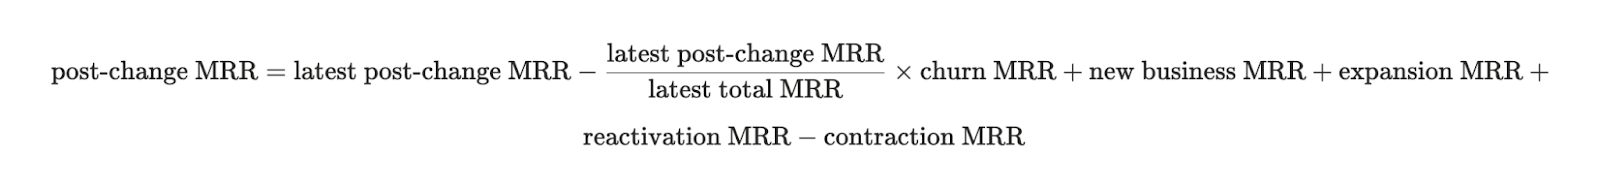
To calculate post-change MRR, ChartMogul uses the latest (last month’s) post-change MRR, the latest (last month’s) total MRR and the projected MRR movements for the month:
The projected total MRR for each month is the sum of pre-change MRR and post-change MRR:

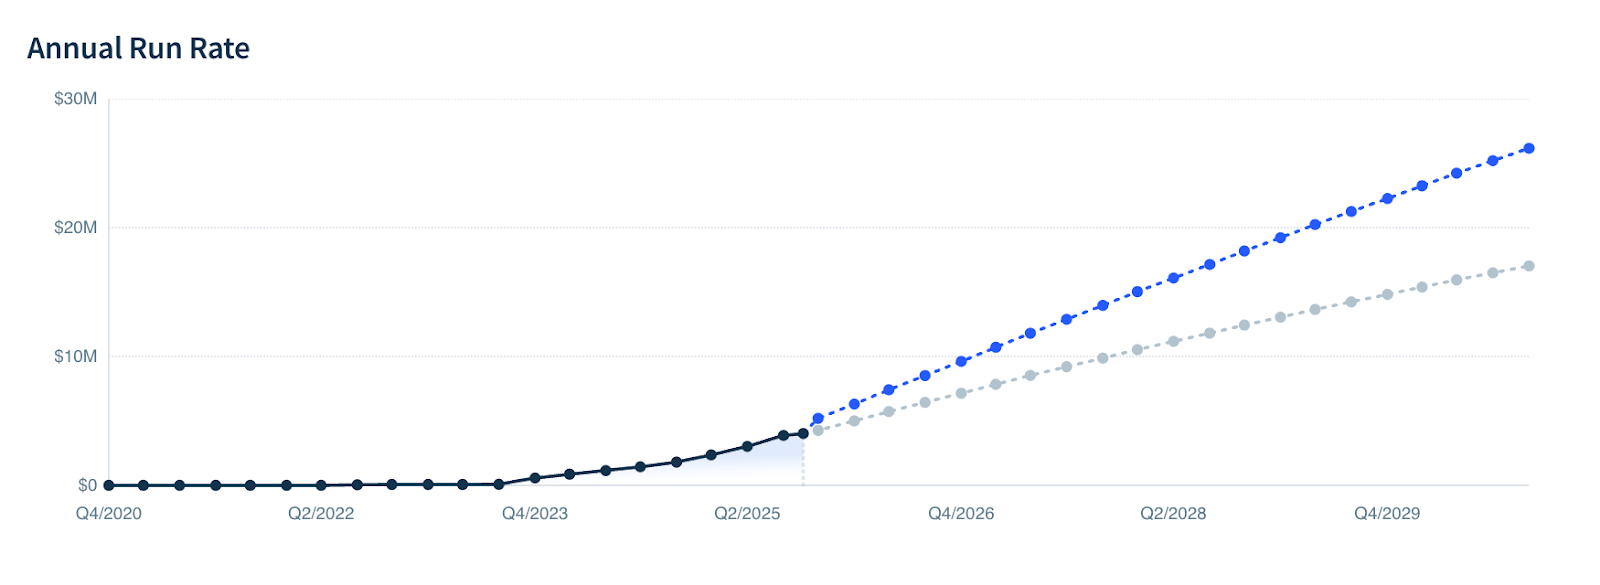
Finally, ChartMogul multiplies the projected total MRR by 12 to convert it to annual run rate (ARR) visible on the chart.